HIGHER INTEREST RATES LEAD TO FEWER HOME SALES
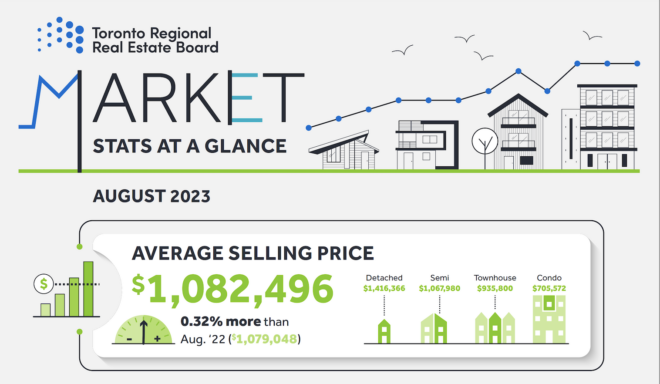
- Higher borrowing costs, continued uncertainty about the economy and Bank of Canada decision making, and the constrained supply of listings resulted in fewer home sales in August 2023 compared to August 2022. The average selling price remained virtually unchanged over the same period.
- New listings were up by 16.2 per cent year-over-over, providing some relief on the supply front, but year-to-date listings are still down substantially compared to the same period last year. Seasonally adjusted sales were down slightly by one per cent month-over-month compared to July 2023, while new listings were up slightly by 1.3 per cent compared to July.
- In the broader Greater Toronto Area (GTA) Markets, sales were down slightly as compared to August 2022, signalling a cooler summer market.
RESIDENTIAL STATS


CONDO PRICES SOFTEN AND SALES PICK UP
- High interest rates has put downward pressure on condominium prices (down 4.2% compared to Q2 last year) and sales have simultaneously picked up (increased by 20.7% compared to Q2 last year)
- The constraint of new listing is keeping a steady flow of sales in the condo market, but not creating a frenzy within the condominium market with listings taking slightly longer to sell than during the same period last year (20 days on market vs. 15 days on market during Q2 last year).
- Condominium rentals are up on all fronts, including number of rentals, price and new listings coming to market.
CONDOMINIUM SALES STATS


CONDOMINIUM RENTAL STATS

COMMERCIAL STATS

The “All Leasing Activity (Sq. Ft.)” chart summarizes total industrial, commercial/retail and office square feet leased through Toronto MLS® regardless of pricing terms.
The “All Sales Activity” chart summarizes total industrial and commercial/retail and office sales through Toronto MLS® regardless of pricing terms.

In conjunction with the Toronto Regional Real Estate Board (TRREB) redistricting project, historical data may be subject to revision moving forward. This could temporarily impact per cent change comparisons to data from previous years.
Distinctive Real Estate Advisors Inc., Brokerage is pleased to present a recap of the latest market forecast release and August highlights from the Toronto Regional Real Estate Board (TRREB).
We’d welcome an opportunity to discuss the Cooler Toronto Market Holds Steady Through Summer. If you have any questions about our services, please contact our team.

Comments