first time home buyer –

Distinctive Advisors Inc.

Menu

Distinctive Real Estate Advisors Inc., Brokerage | Distinctive Real Estate Advisors Inc., Mortgage Broker License #12592

Tag Archives: first time home buyer

Ottawa MLS® October Home Sales Show Typical Lull

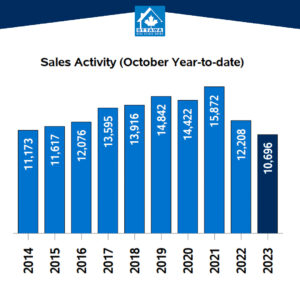
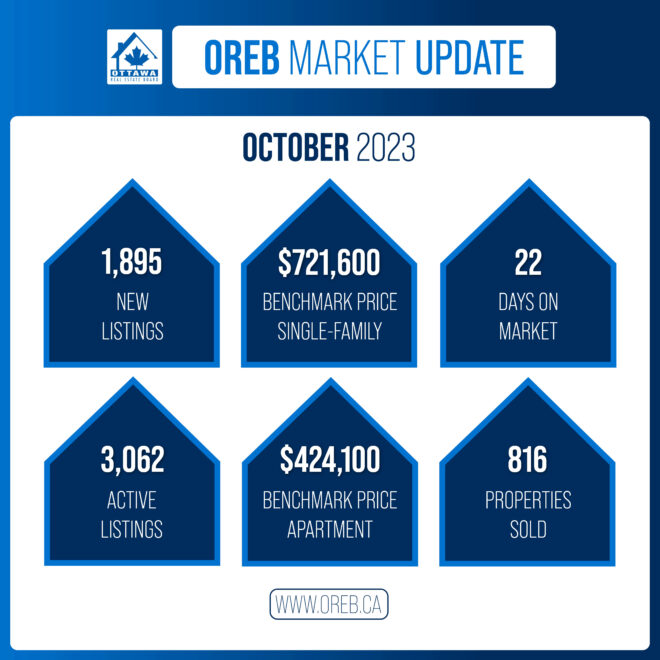
The number of homes sold through the MLS® System of the Ottawa Real Estate Board totaled 816 units in October 2023. This was a small reduction of 2.7% from October 2022.

Home sales were 36.4% below the five-year average and 30.8% below the 10-year average for the month of October.

On a year-to-date basis, home sales totaled 10,700 units over the first 10 months of the year. This was a substantial decline of 12.3% from the same period in 2022.

Life is expensive these days, which likely has both buyers and sellers staying put. We’re seeing a slow decline in sales activity but it’s minimal and not unexpected for this time of year. Prices are adjusting and coming down, which is also indicative of the types of homes that are selling — apartments seeing the largest increase in sales activity over last October. While Ottawa’s inventory is slowly building, chronic supply issues mean there’s always an undercurrent of demand. Don’t let the lull fool you: now is a prime time for buyers to be looking for opportunities before the current carries us from a balanced market into seller’s territory.
BY THE NUMBERS: PRICES

The MLS® Home Price Index (HPI) tracks price trends far more accurately than is possible using average or median price measures.

  • The overall MLS® HPI composite benchmark price was $638,600 in October 2023, nearly unchanged, up only 1.8% from October 2022.
    • The benchmark price for single-family homes was $721,600, up 2.2% on a year-over-year basis in September.
    • By comparison, the benchmark price for a townhouse was $501,100, nearly unchanged, up 1% compared to a year earlier.
    • o The benchmark apartment price was $424,100, unchanged from year-ago levels.
  • The average price of homes sold in October 2023 was $660,836, increasing 2.9% from October 2022. The more comprehensive year-to-date average price was $671,983, a decline of 5.9% from the first ten months of 2022.
  • The dollar value of all home sales in October 2023 was $539.2 million, unchanged from the same month in 2022.

OREB cautions that the average sale price can be useful in establishing trends over time but should not be used as an indicator that specific properties have increased or decreased in value. The calculation of the average sale price is based on the total dollar volume of all properties sold. Price will vary from neighbourhood to neighbourhood.
 

BY THE NUMBERS — INVENTORY AND NEW LISTINGS

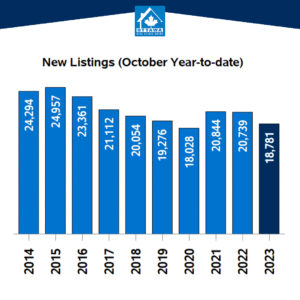
  • The number of new listings saw an increase of 6.6% from October 2022. There were 1,895 new residential listings in October 2023. New listings were 2% above the five-year average and 5.4% above the 10-year average for the month of October.
  • Active residential listings numbered 3,062 units on the market at the end of October, a sizable gain of 16.7% from the end of October 2022. Active listings haven’t been this high in the month of October in more than five years.
  • Active listings were 43.8% above the five-year average and 10.9% below the 10-year average for the month of October.
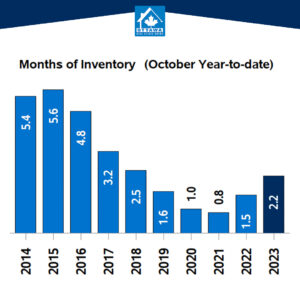
  • Months of inventory numbered 3.8 at the end of October 2023, just up from the 3.1 months recorded at the end of October 2022. The number of months of inventory is the number of months it would take to sell current inventories at the current rate of sales activity.
In conjunction with the Ottawa Real Estate Board (OREB), historical data may be subject to revision moving forward. This could temporarily impact per cent change comparisons to data from previous years.

Distinctive Real Estate Advisors Inc., Brokerage is pleased to present a recap of the latest market forecast release and October highlights from the Ottawa Real Estate Board (OREB).

We’d welcome an opportunity to discuss the Ottawa MLS® October Home Sales Show Typical Lull. If you have any questions about our services, please contact our team.
Ottawa MLS® Home Sales Hold Steady in Lackluster September

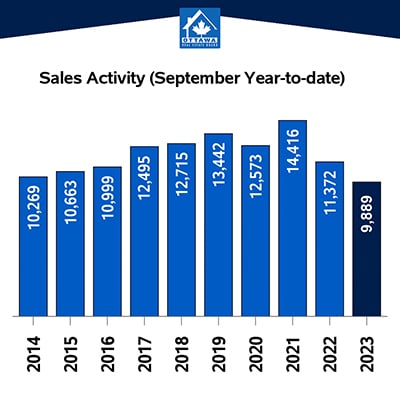
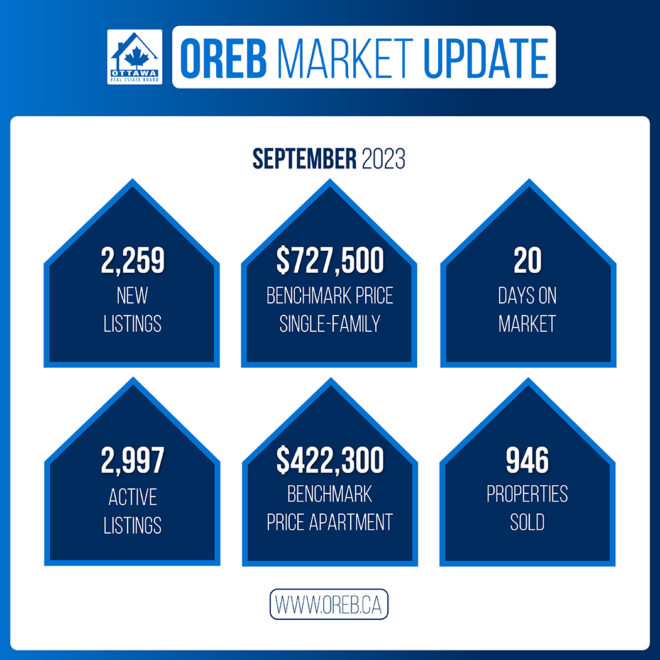
The number of homes sold through the MLS® System of the Ottawa Real Estate Board (OREB) totaled 946 units in September 2023. This was unchanged from September 2022.

Home sales were 29.6% below the five-year average and 23.6% below the 10-year average for the month of September. On a year-to-date basis, home sales totaled 9,889 units over the first nine months of the year. This was a large decline of 13% from the same period in 2022.

Sales activity came in right on par with where it stood at the same time last year but was still running well below typical levels for a September. New listings have surged in the past several months, which has caused overall inventories to begin gradually rising again. However, available supply is still low by historical standards, and we have ample room to absorb more listings coming on the market. Our market is also right in the middle of balanced territory, and while MLS® Benchmark prices are down from last year they are still trending at about the same levels from 2021.

BY THE NUMBERS — PRICES

The MLS® Home Price Index (HPI) tracks price trends far more accurately than is possible using average or median price measures.

  • The overall MLS® HPI composite benchmark price was $643,600 in September 2023, nearly unchanged, up only 0.5% compared to September 2022.
    • The benchmark price for single-family homes was $727,500, essentially unchanged, up just 0.6% on a year-over-year basis in September.
    • By comparison, the benchmark price for townhouse/row units was $510,900, a small gain of 2.5% compared to a year earlier, while the benchmark apartment price was $422,300, falling by 1.1% from year-ago levels.
  • The average price of homes sold in September 2023 was $675,412, increasing by 2.7% from September 2022. The more comprehensive year-to-date average price was $672,837, a decline of 6.5% from the first nine months of 2022.
  • The dollar value of all home sales in September 2023 was $638.9 million, up modestly by 2.7% from the same month in 2022.

OREB cautions that the average sale price can be useful in establishing trends over time but should not be used as an indicator that specific properties have increased or decreased in value. The calculation of the average sale price is based on the total dollar volume of all properties sold. Price will vary from neighbourhood to neighbourhood.

BY THE NUMBERS — INVENTORY & NEW LISTINGS

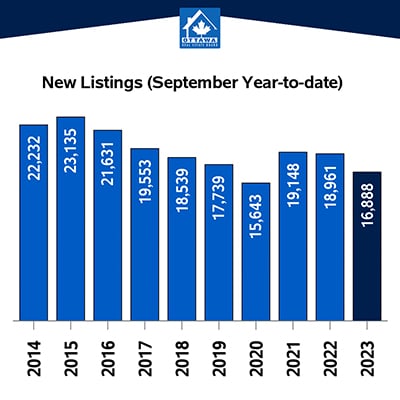
  • The number of new listings saw an increase of 9.8% from September 2022. There were 2,259 new residential listings in September 2023. New listings were 4.8% above the five-year average and 7% above the 10-year average for the month of September.
  • Active residential listings numbered 2,997 units on the market at the end of September, a sizable gain of 14% from the end of September 2022. Active listings haven’t been this high in the month of September in five years.
  • Active listings were 33.9% above the five-year average and 18.5% below the 10-year average for the month of September.
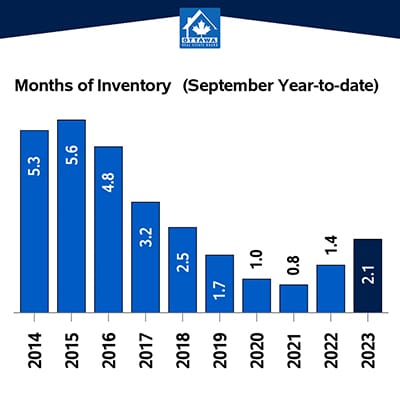
  • Months of inventory numbered 3.2 at the end of September 2023, up from the 2.8 months recorded at the end of September 2022 and below the long-run average of 3.3 months for this time of year. The number of months of inventory is the number of months it would take to sell current inventories at the current rate of sales activity.

In conjunction with the Ottawa Real Estate Board (OREB), historical data may be subject to revision moving forward. This could temporarily impact per cent change comparisons to data from previous years.

Distinctive Real Estate Advisors Inc., Brokerage is pleased to present a recap of the latest market forecast release and September highlights from the Ottawa Real Estate Board (OREB).

We’d welcome an opportunity to discuss the Ottawa MLS® Home Sales Hold Steady in Lackluster September. If you have any questions about our services, please contact our team.
Cooler Toronto Market Holds Steady Through Summer

HIGHER INTEREST RATES LEAD TO FEWER HOME SALES

  • Higher borrowing costs, continued uncertainty about the economy and Bank of Canada decision making, and the constrained supply of listings resulted in fewer home sales in August 2023 compared to August 2022. The average selling price remained virtually unchanged over the same period.
  • New listings were up by 16.2 per cent year-over-over, providing some relief on the supply front, but year-to-date listings are still down substantially compared to the same period last year. Seasonally adjusted sales were down slightly by one per cent month-over-month compared to July 2023, while new listings were up slightly by 1.3 per cent compared to July.
  • In the broader Greater Toronto Area (GTA) Markets, sales were down slightly as compared to August 2022, signalling a cooler summer market.

RESIDENTIAL STATS

Total Residential Transactions Average Selling Price Total New Listings Residential Property Days on Market

CONDO PRICES SOFTEN AND SALES PICK UP

  • High interest rates has put downward pressure on condominium prices (down 4.2% compared to Q2 last year) and sales have simultaneously picked up (increased by 20.7% compared to Q2 last year)
  • The constraint of new listing is keeping a steady flow of sales in the condo market, but not creating a frenzy within the condominium market with listings taking slightly longer to sell than during the same period last year (20 days on market vs. 15 days on market during Q2 last year).
  • Condominium rentals are up on all fronts, including number of rentals, price and new listings coming to market.

CONDOMINIUM SALES STATS

Total Condo Apartment Sales Total New Listings Condo

CONDOMINIUM RENTAL STATS

Apartment Rental Stats

COMMERCIAL STATS

All Leasing Activity

The “All Leasing Activity (Sq. Ft.)” chart summarizes total industrial, commercial/retail and office square feet leased through Toronto MLS® regardless of pricing terms.
The “All Sales Activity” chart summarizes total industrial and commercial/retail and office sales through Toronto MLS® regardless of pricing terms.

Average Leasing Rates Commercial

In conjunction with the Toronto Regional Real Estate Board (TRREB) redistricting project, historical data may be subject to revision moving forward. This could temporarily impact per cent change comparisons to data from previous years.

Distinctive Real Estate Advisors Inc., Brokerage is pleased to present a recap of the latest market forecast release and August highlights from the Toronto Regional Real Estate Board (TRREB).

We’d welcome an opportunity to discuss the Cooler Toronto Market Holds Steady Through Summer. If you have any questions about our services, please contact our team.
Rental Payments can be used to build Credit Scores for Canadians

For the past eight years Canadians have had the ability to use mortgage payments to build their credit scores. However, for a large segment of the population — including first time home buyers — building a credit score to qualify for a mortgage can be a challenge since rental payment data has not historically been factored in.

Approximately 33 per cent of Canadians pay rent, which for most is the largest single monthly expense. To date, this information has not been factored into an individual’s credit score due to the burden of collecting the data, but the Landlord Credit Bureau is working hard to change that. They have created a portal where Landlords will upload rental payment data which will be provided directly to Equifax, where Landlords will also benefit from the ability to pull a tenant’s payment history data to determine their creditworthiness.

Although this won’t replace the need to build credit in other ways, it certainly is a step in the right direction to break down barriers to entry in the Canadian housing market.

Are you currently renting and thinking about purchasing your first property? Talk to our team today and let us help you find the best path toward owning your own home.

« Older Entries

Newer Entries »