real estate –

Distinctive Advisors Inc.

Menu

Distinctive Real Estate Advisors Inc., Brokerage | Distinctive Real Estate Advisors Inc., Mortgage Broker License #12592

Tag Archives: real estate

A Slow May in Toronto Real Estate

May home sales continued at low levels, especially in comparison to last spring’s short-lived pick-up in market activity. Home buyers are still waiting for relief on the mortgage rate front.

Existing homeowners are anticipating an uptick in demand, as evidenced by a year-over-year increase in new listings. With more choice compared to a year ago, buyers benefited from more negotiating room on prices.

Recent polling from Ipsos indicates that home buyers are waiting for clear signs of declining mortgage rates. As borrowing costs decrease over the next 18 months, more buyers are expected to enter the market, including many first-time buyers. This will open up much needed space in a relatively tight rental market.

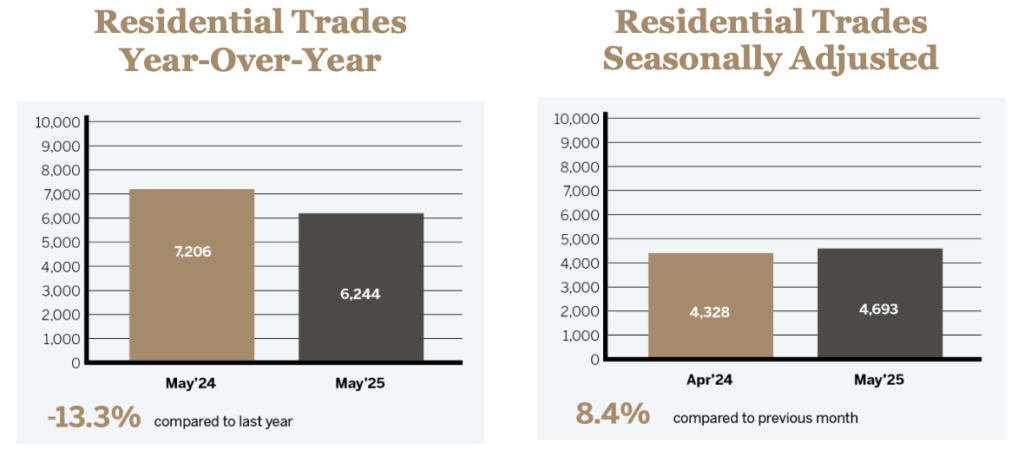
TOTAL RESIDENTIAL TRANSACTIONS

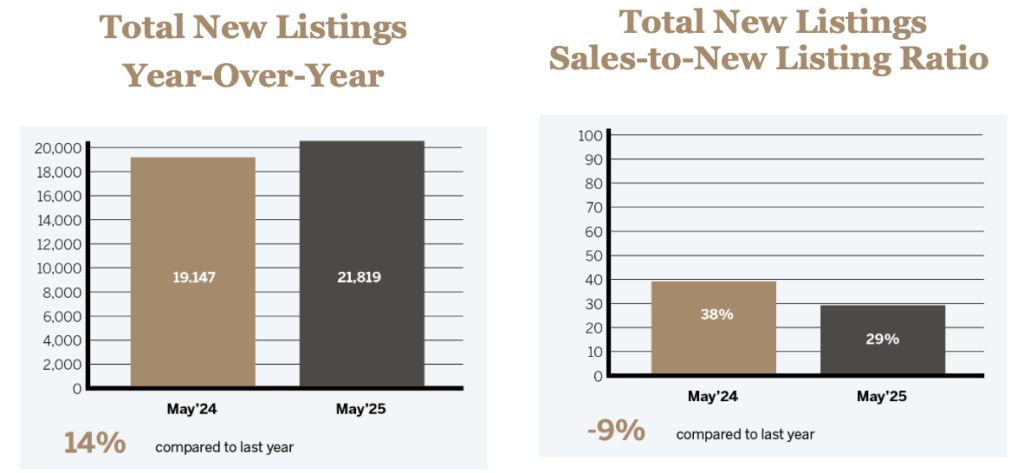
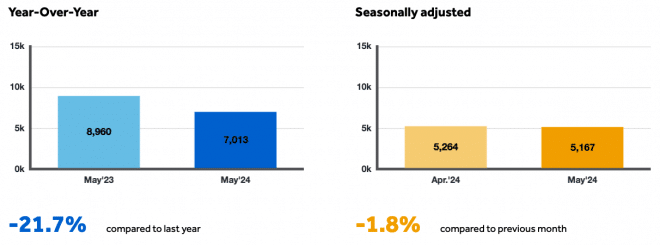
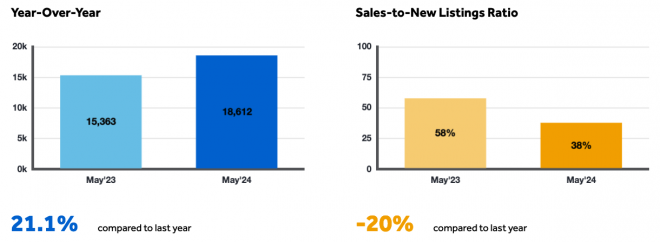
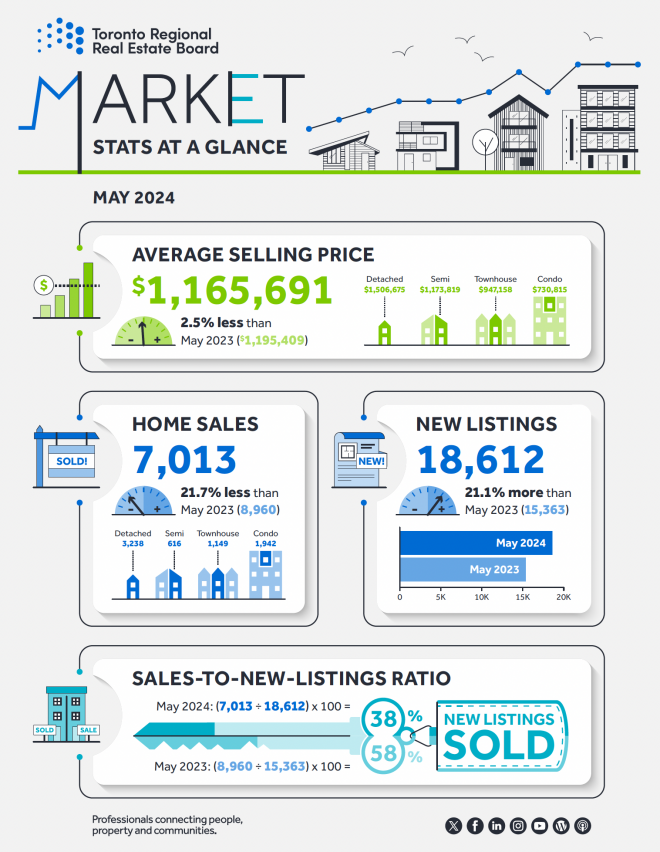
In the Greater Toronto Area, 7,013 home sales were reported through TRREB’s MLS System in May 2024 – a 21.7 per cent decline compared to 8,960 sales reported in May 2023. New listings entered into the MLS System amounted to 18,612 – up by 21.1 per cent year-over-year.

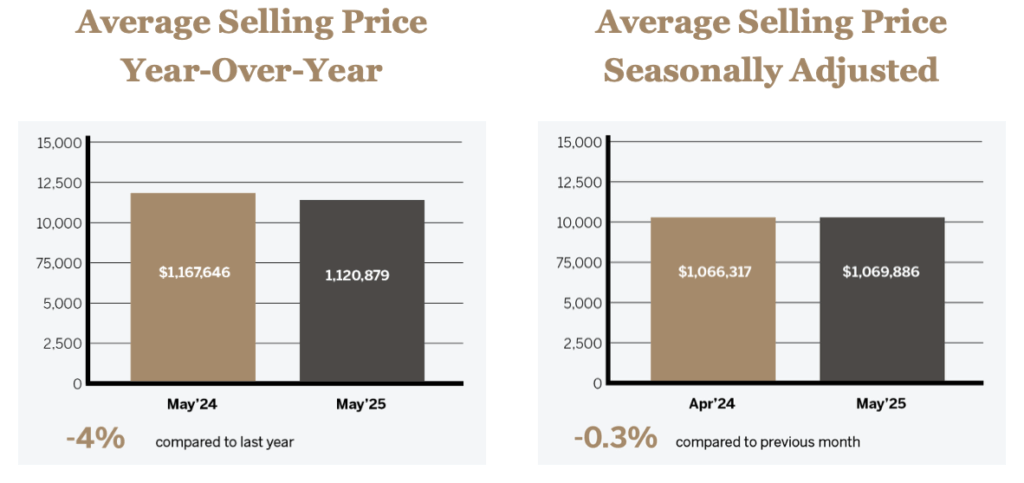
AVERAGE SELLING PRICE

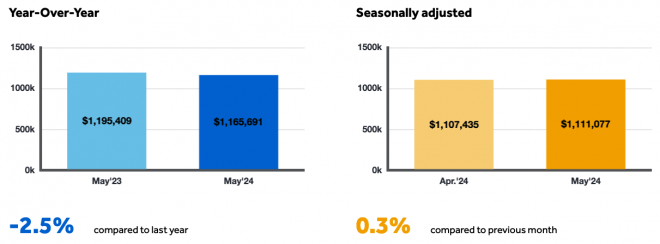
The MLS® Home Price Index Composite benchmark was down by 3.5 per cent on a year-over-year basis in May 2024. The average selling price of $1,165,691 was down by 2.5 per cent over the May 2023 result of $1,195,409. On a seasonally adjusted monthly basis, the average selling price edged up slightly compared to April 2024.

TOTAL NEW LISTINGS

AVERAGE DAYS ON MARKET

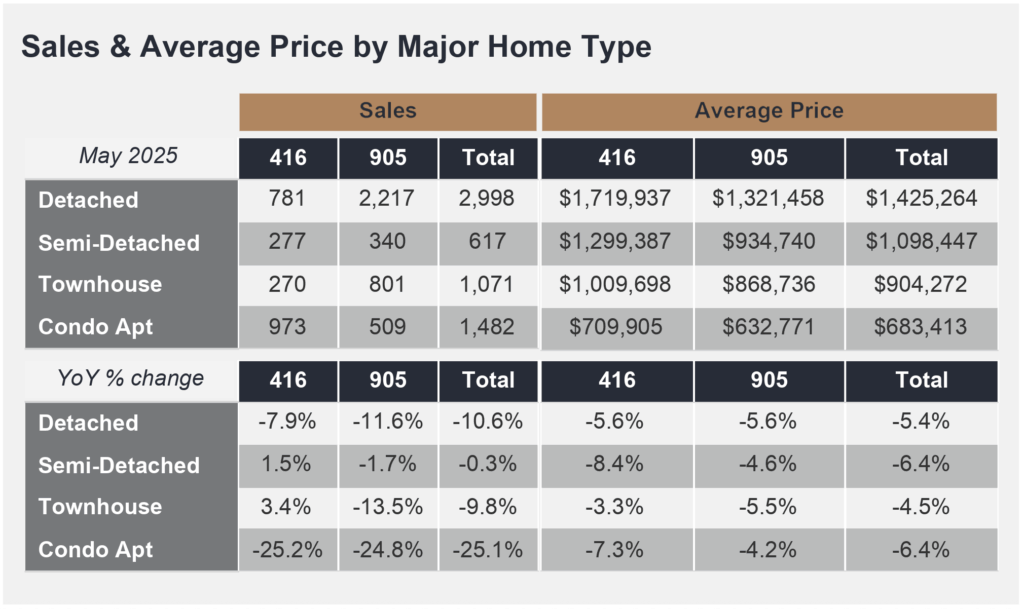
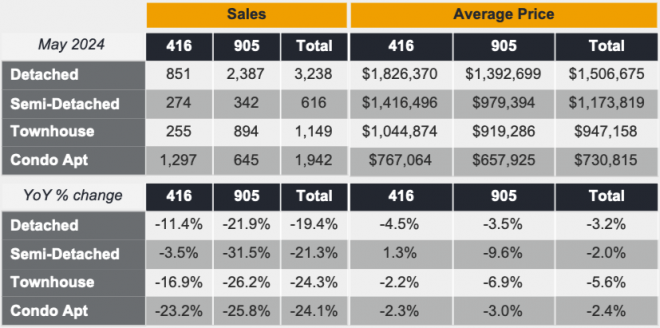
SALES & AVERAGE PRICE BY MAJOR HOME TYPE

Final Thoughts:

While interest rates remained high in May, home buyers did continue to benefit from slightly lower selling prices compared to last year. We have seen selling prices adjust to mitigate the impact of higher mortgage rates. Affordability is expected to improve further as borrowing costs trend lower. However, as demand picks up, we will likely see renewed upward pressure on home prices as competition between buyers increases.

In order to have an affordable and livable region over the long term, we need to see a coordinated effort from all levels of government to alleviate our current housing deficit and to provide housing for new population moving forward.

On top of this, governments need to ensure the delivery of infrastructure to support our growing population. The economic health and livability of our region depends on the timely completion of public transit projects including better transparency and clear timelines on the completion of the Eglinton Crosstown LRT.

Distinctive Real Estate Advisors Inc., Brokerage is pleased to present a recap of the latest market forecast release and May highlights from the Toronto Regional Real Estate Board (TRREB).

We’d welcome an opportunity to discuss A Slow May in Toronto Real Estate more. If you have any questions about our services, please contact our team.

Modest Gains Across Ottawa’s MLS in April

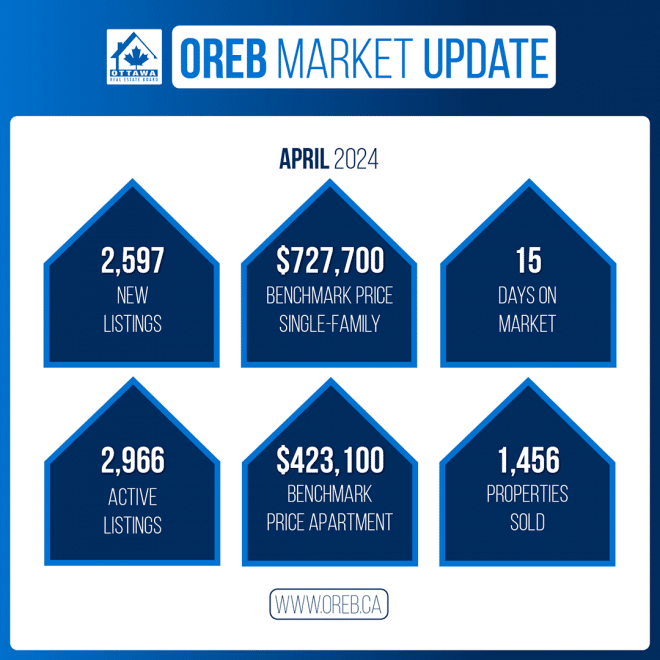
The number of homes sold through the MLS® System of the Ottawa Real Estate Board (OREB) totaled 1,456 units in April 2024. This was an increase of 8.9% from April 2023.

Home sales were 2% below the five-year average and 6.9% below the 10-year average for the month of April.

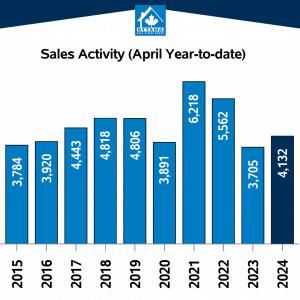
On a year-to-date basis, home sales totaled 4,132 units over the first four months of the year — an increase of 11.5% from the same period in 2023.

“It’s a typical spring in Ottawa’s real estate market,” says OREB President Curtis Fillier. “What sets it apart from recent springs is a restored mutual confidence among both buyers and sellers. Buoyed by recent sales activity, sellers are more confident that they can move their property as evidenced by the uptick in listings. For buyers, the pressure of the pandemic market has eased and they’re comfortable taking the time to find the property that best suits their needs. The pace is still conservative while the economy is holding some back, but overall Ottawa’s market is strong and stable, and that’s a win-win.”

“The real story is in the details,” says Fillier. “Looking more closely at what’s selling and for how much suggests the demographic of buyer is changing. While most of Ottawa’s market is in balanced territory, townhomes have shifted to the seller’s market side as supply shrinks. Single-family homes are the most active market, which is inflating the average sale price. The next few months will be both telling and interesting as people continue to redefine their post-pandemic normal amid an upcoming federal election and back-to-work mandate for government workers. The detailed insights and data that REALTORS® have unique access to will be invaluable in helping buyers fine-tune their strategy for their specific neighbourhood and property type.”

By the Numbers – Prices:

The MLS® Home Price Index (HPI) tracks price trends far more accurately than is possible using average or median price measures.

  • The overall MLS® HPI composite benchmark price was $643,700 in April 2024, a marginal gain of 1.6% from April 2023.
    • The benchmark price for single-family homes was $727,700, up 1.6% on a year-over-year basis in April.
    • By comparison, the benchmark price for a townhouse/row unit was $500,800, up slightly at 1% compared to a year earlier.
    • The benchmark apartment price was $423,100, up 2.1% from year-ago levels.
  • The average price of homes sold in April 2024 was $705,117 increasing 1.2% from April 2023. The more comprehensive year-to-date average price was $675,817, increasing by 2.4% from the first four months of 2023.
  • The dollar volume of all home sales in April 2024 was $1.02 billion, up 10.2% from the same month in 2023.

OREB cautions that the average sale price can be useful in establishing trends over time but should not be used as an indicator that specific properties have increased or decreased in value. The calculation of the average sale price is based on the total dollar volume of all properties sold. Prices will vary from neighbourhood to neighbourhood.

By the Numbers – Inventory and New Listings:

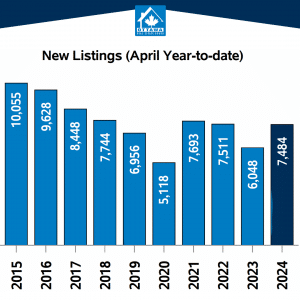
The number of new listings saw an increase of 40.5% from April 2023. There were 2,597 new residential listings in April 2024. New listings were 19.7% above the five-year average and 4.6% above the 10-year average for the month of April.

Active residential listings numbered 2,966 units on the market at the end of April 2024, a gain of 36.6% from April 2023. Active listings were 62.6% above the five-year average and 13.7% below the 10-year average for the month of April.

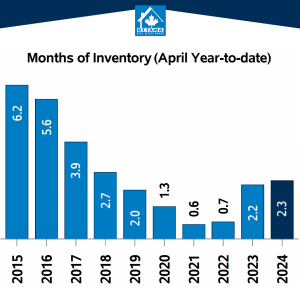
Months of inventory numbered 2 at the end of April 2024, up only slightly from 1.6 in April 2023. The number of months of inventory is the number of months it would take to sell current inventories at the current rate of sales activity.

In conjunction with the Ottawa Real Estate Board (OREB), historical data may be subject to revision moving forward. This could temporarily impact per cent change comparisons to data from previous years.

Distinctive Real Estate Advisors Inc., Brokerage is pleased to present a recap of the latest market forecast release and April highlights from the Ottawa Real Estate Board (OREB).

We’d welcome an opportunity to discuss the Modest Gains Across Ottawa’s MLS Market a Sign of Shared Confidence. If you have any questions about our services, please contact our team.

Ottawa MLS Market Shows Early Signs of a Buzzing Spring Market

The number of homes sold through the MLS® System of the Ottawa Real Estate Board totaled 1,165 units in March 2024. This was an increase of 10% from March 2023.

Home sales were 21.5% below the five-year average and 15% below the 10-year average for the month of March.

On a year-to-date basis, home sales totaled 2,678 units over the first three months of the year — an increase of 13.1% from the same period in 2023.

“Ottawa’s real estate market is overall healthy, providing fertile ground for an active spring and summer ahead,” says OREB President Curtis Fillier. “The increases in new and active listings indicate that sellers are feeling more confident, boosted by the rise in showing activity. Buyers, however, aren’t acting as quickly as they perhaps should be — likely because affordability and supply are still roadblocks.”

“Something is around the corner in this market, though,” says Fillier. “People have adjusted to post-pandemic life and that means revisiting their housing needs. Some are downsizing or moving in from the city’s outskirts. Others are looking at more suitable properties that better meet all their needs, which weren’t accessible to them in the peak pandemic market. That’s creating pressure from multiple angles on the mid-range property market, which we know is tight to begin with in Ottawa. Just because you’re in the real estate market, doesn’t mean you’re safe from the market. If you’re a buyer or seller looking to make a move, I wouldn’t wait too long.”

By the Numbers – Prices:

The MLS® Home Price Index (HPI) tracks price trends far more accurately than is possible using average or median price measures.

  • The overall MLS® HPI composite benchmark price was $636,700 in March 2024, a gain of 2.7% from March 2023.
    • The benchmark price for single-family homes was $719,000, up 2.6% on a year-over-year basis in March.
    • By comparison, the benchmark price for a townhouse/row unit was $489,800, up slightly at 0.9% compared to a year earlier.
    • The benchmark apartment price was $423,200, up 4.3% from year-ago levels.
  • The average price of homes sold in March 2024 was $682,078 increasing 5.1% from March 2023. The more comprehensive year-to-date average price was $659,828, increasing by 3.2% from the first three months of 2023.
  • The dollar volume of all home sales in March 2024 was $794.6 million, up 15.6% from the same month in 2023.

OREB cautions that the average sale price can be useful in establishing trends over time but should not be used as an indicator that specific properties have increased or decreased in value. The calculation of the average sale price is based on the total dollar volume of all properties sold. Prices will vary from neighbourhood to neighbourhood.

By the Numbers – Inventory and New Listings:

  • The number of new listings saw an increase of 13.5% from March 2023. There were 2,074 new residential listings in March 2024. New listings were 2.3% below the five-year average and 11.1% below the 10-year average for the month of March.
  • Active residential listings numbered 2,543 units on the market at the end of March 2024, a gain of 18.3% from March 2023. Active listings were 58.6% above the five-year average and 17.7% below the 10-year average for the month of March. Active listings haven’t been this high in the month of March in more than five years.
  • Months of inventory numbered 2.2 at the end of March 2024, up only slight from 2 in March 2023 and below the long-run average of 2.6 months for this time of year. The number of months of inventory is the number of months it would take to sell current inventories at the current rate of sales activity.

In conjunction with the Ottawa Real Estate Board (OREB), historical data may be subject to revision moving forward. This could temporarily impact per cent change comparisons to data from previous years.

Distinctive Real Estate Advisors Inc., Brokerage is pleased to present a recap of the latest market forecast release and March highlights from the Ottawa Real Estate Board (OREB).

We’d welcome an opportunity to discuss the Ottawa’s MLS® Market Shows Early Signs of a Buzzing Spring Market. If you have any questions about our services, please contact our team.

GTA REALTORS® Release March 2024 Stats

The latest data from the Toronto Regional Real Estate Board (TRREB) reveals some interesting trends in the GTA housing market for March 2024.

Despite a slight dip in sales compared to March 2023, largely attributed to the timing of Good Friday, the GTA real estate landscape is showing signs of vitality and resilience.

RESIDENTIAL STATS

Key Highlights:

  • A total of 6,560 homes were sold in March 2024, marking a modest 4.5% decrease from March 2023.
  • New listings surged by 15%, indicating a healthier market supply. The average selling price saw a slight increase of 1.3% year-over-year to $1,121,615.
  • A noticeable uptick in new listings by 18.3% year-over-year in the first quarter reflects a market ready for spring.

Market Insights:

TRREB President Jennifer Pearce notes, “A gradual market improvement with more buyers adjusting to higher interest rates, and anticipation for a stronger spring market contributed to the significant rise in new listings.”

What is seasonal adjustment? Seasonality refers to a monthly (or quarterly) pattern that occurs in roughly the same manner from one year to the next, e.g., sales are highest in the spring and lowest in the winter each year.

HPI provides a price growth measure for a benchmark home with the same characteristics over time, allowing for an apples-to-apples comparison from one year to the next.

Future Outlook:

Experts predict an acceleration in price growth as the market heads into spring, driven by lower borrowing costs and a tighter market. TRREB Chief Market Analyst Jason Mercer anticipates, “Price growth is expected to accelerate, with sellers’ market conditions emerging in many neighbourhoods.”

A Call for Action on Housing Supply: 

As demand for both ownership and rental housing increases, TRREB CEO emphasizes the need for innovative solutions to boost housing supply and affordability. This includes exploring co-ownership models and encouraging gentle density in high-demand areas.

Final Thoughts:

The GTA real estate market is poised for an exciting period of growth and evolution. With anticipated lower borrowing costs and a focus on increasing housing supply, we’re looking forward to seeing how these dynamics will shape the market in the coming months. Stay tuned for more updates and insights into the GTA housing market!


Distinctive Real Estate Advisors Inc., Brokerage is pleased to present a recap of the latest market forecast release and March highlights from the Toronto Regional Real Estate Board (TRREB).

We’d welcome an opportunity to discuss the GTA REALTORS Release March 2024 Stats. If you have any questions about our services, please contact our team.

« Older Entries