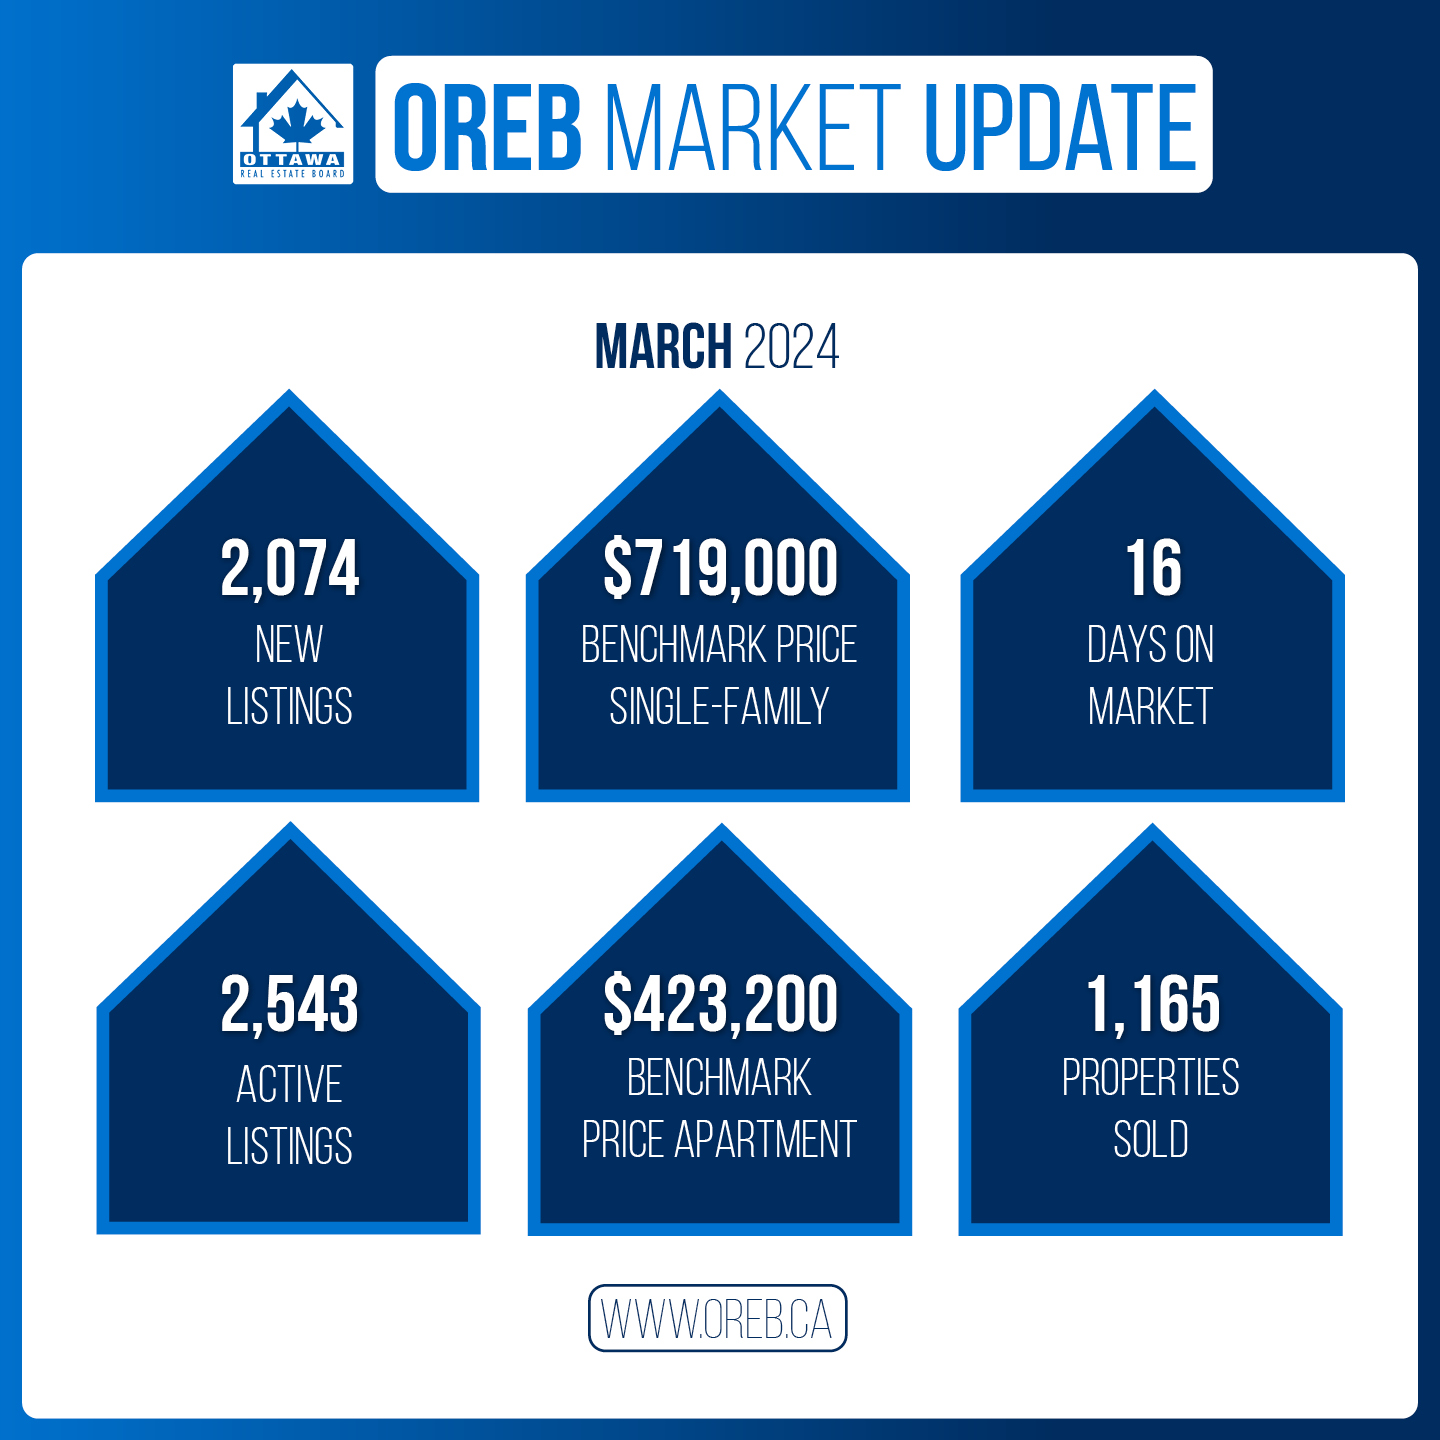
The number of homes sold through the MLS® System of the Ottawa Real Estate Board totaled 1,165 units in March 2024. This was an increase of 10% from March 2023.
Home sales were 21.5% below the five-year average and 15% below the 10-year average for the month of March.
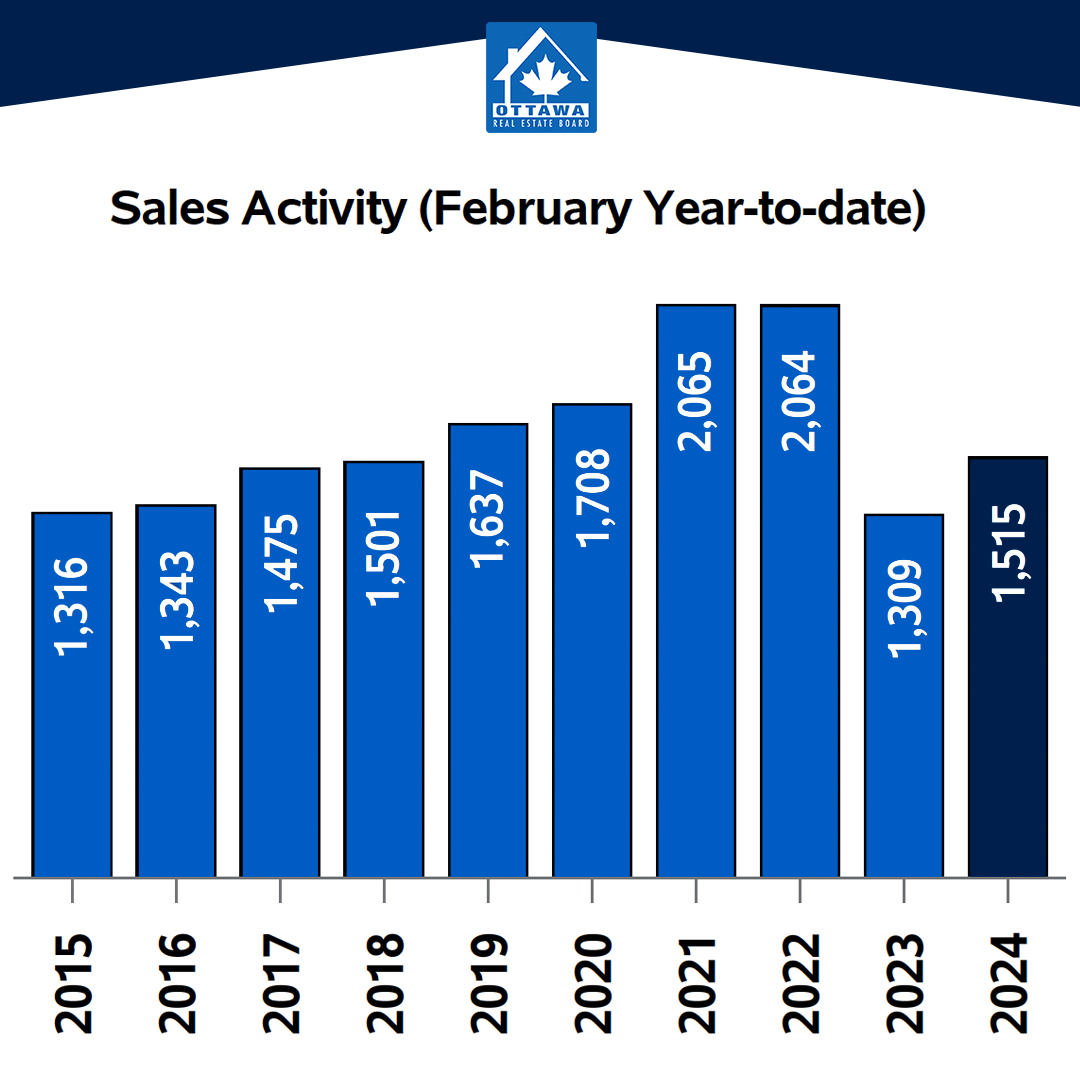
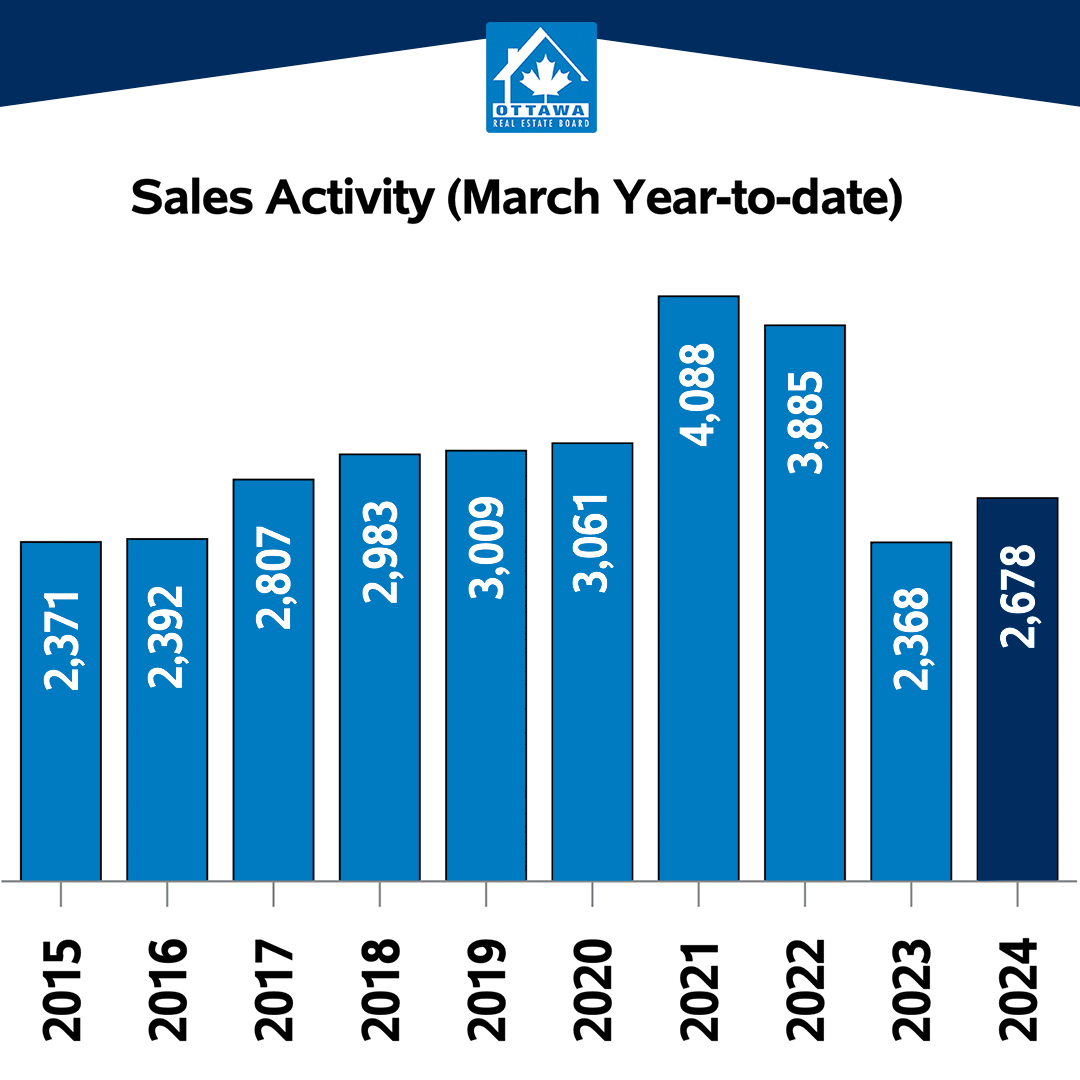
On a year-to-date basis, home sales totaled 2,678 units over the first three months of the year — an increase of 13.1% from the same period in 2023.
“Ottawa’s real estate market is overall healthy, providing fertile ground for an active spring and summer ahead,” says OREB President Curtis Fillier. “The increases in new and active listings indicate that sellers are feeling more confident, boosted by the rise in showing activity. Buyers, however, aren’t acting as quickly as they perhaps should be — likely because affordability and supply are still roadblocks.”
“Something is around the corner in this market, though,” says Fillier. “People have adjusted to post-pandemic life and that means revisiting their housing needs. Some are downsizing or moving in from the city’s outskirts. Others are looking at more suitable properties that better meet all their needs, which weren’t accessible to them in the peak pandemic market. That’s creating pressure from multiple angles on the mid-range property market, which we know is tight to begin with in Ottawa. Just because you’re in the real estate market, doesn’t mean you’re safe from the market. If you’re a buyer or seller looking to make a move, I wouldn’t wait too long.”
By the Numbers – Prices:
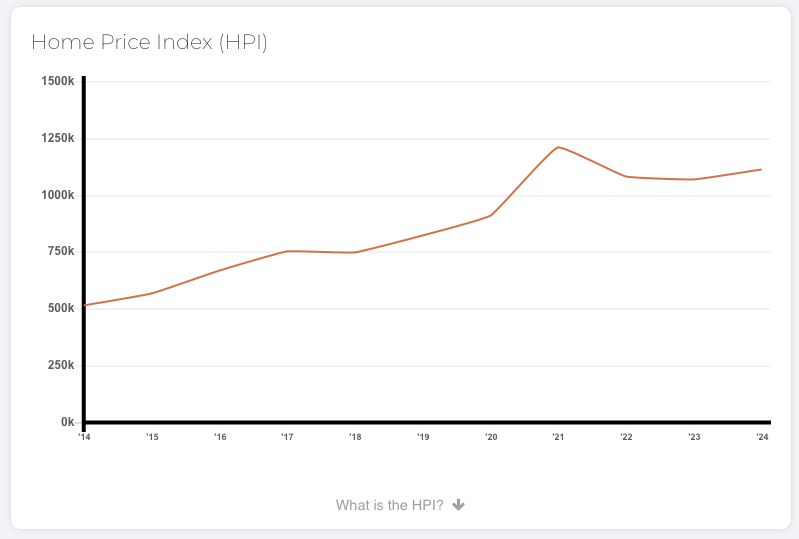
The MLS® Home Price Index (HPI) tracks price trends far more accurately than is possible using average or median price measures.
- The overall MLS® HPI composite benchmark price was $636,700 in March 2024, a gain of 2.7% from March 2023.
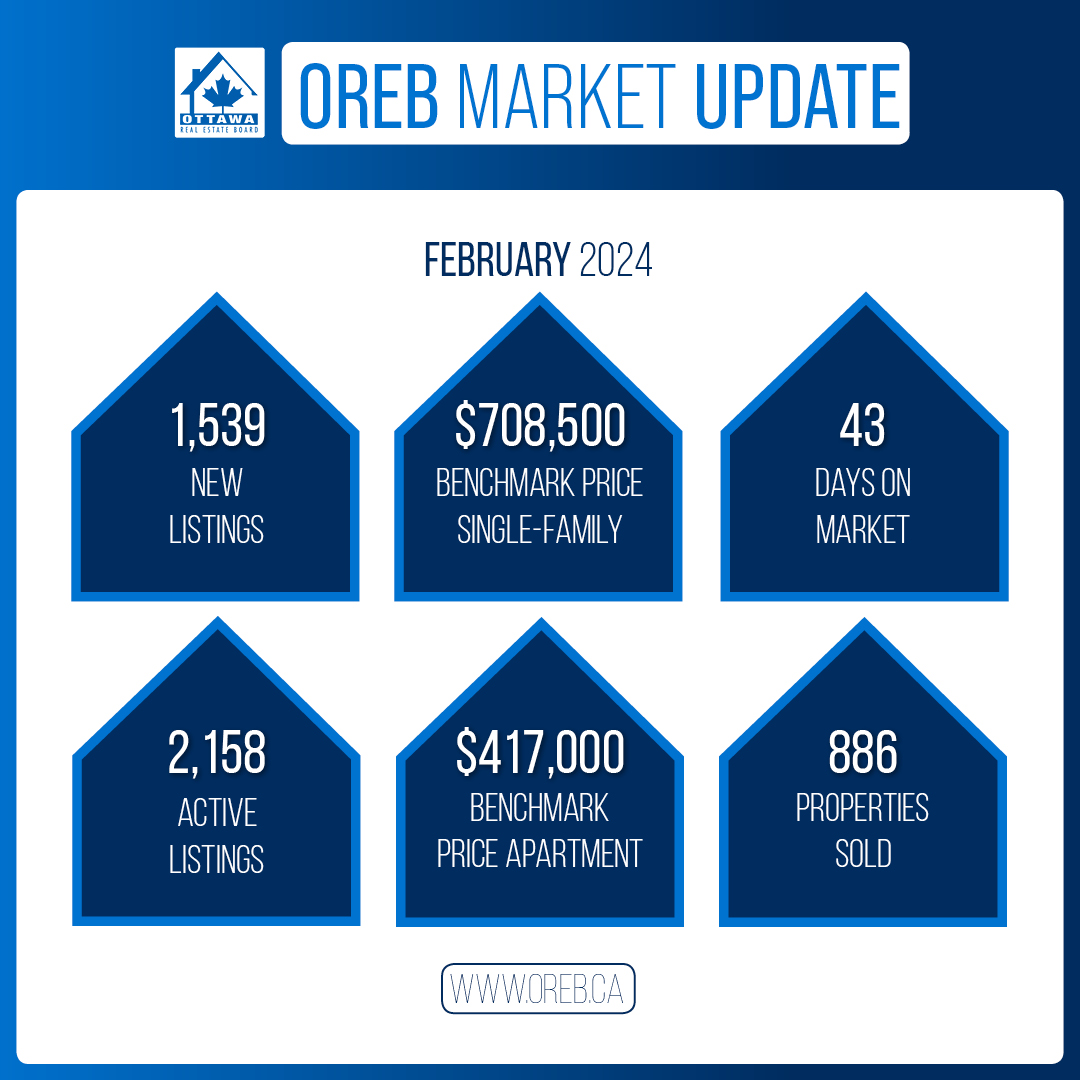
- The benchmark price for single-family homes was $719,000, up 2.6% on a year-over-year basis in March.
- By comparison, the benchmark price for a townhouse/row unit was $489,800, up slightly at 0.9% compared to a year earlier.
- The benchmark apartment price was $423,200, up 4.3% from year-ago levels.
- The average price of homes sold in March 2024 was $682,078 increasing 5.1% from March 2023. The more comprehensive year-to-date average price was $659,828, increasing by 3.2% from the first three months of 2023.
- The dollar volume of all home sales in March 2024 was $794.6 million, up 15.6% from the same month in 2023.
OREB cautions that the average sale price can be useful in establishing trends over time but should not be used as an indicator that specific properties have increased or decreased in value. The calculation of the average sale price is based on the total dollar volume of all properties sold. Prices will vary from neighbourhood to neighbourhood.
By the Numbers – Inventory and New Listings:
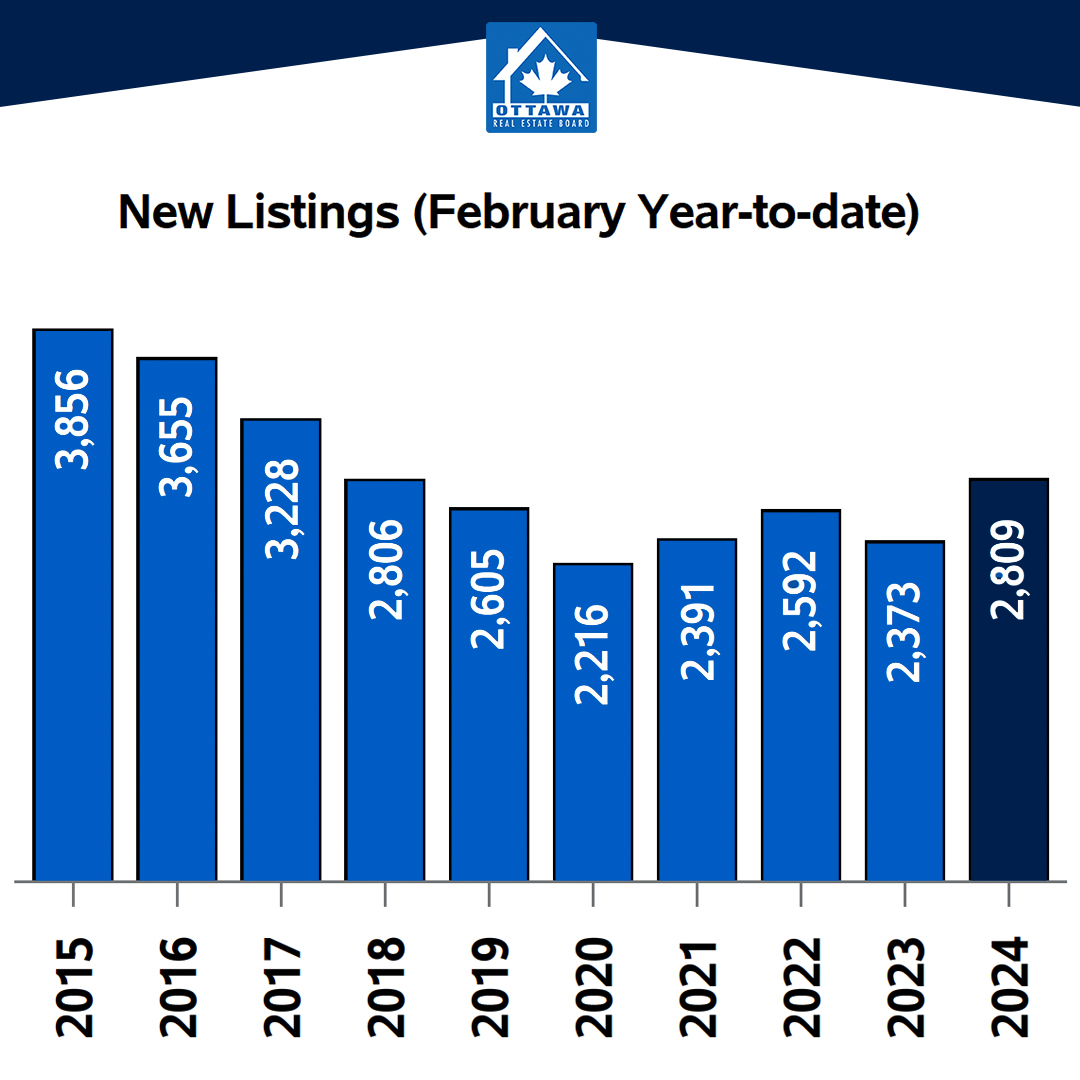
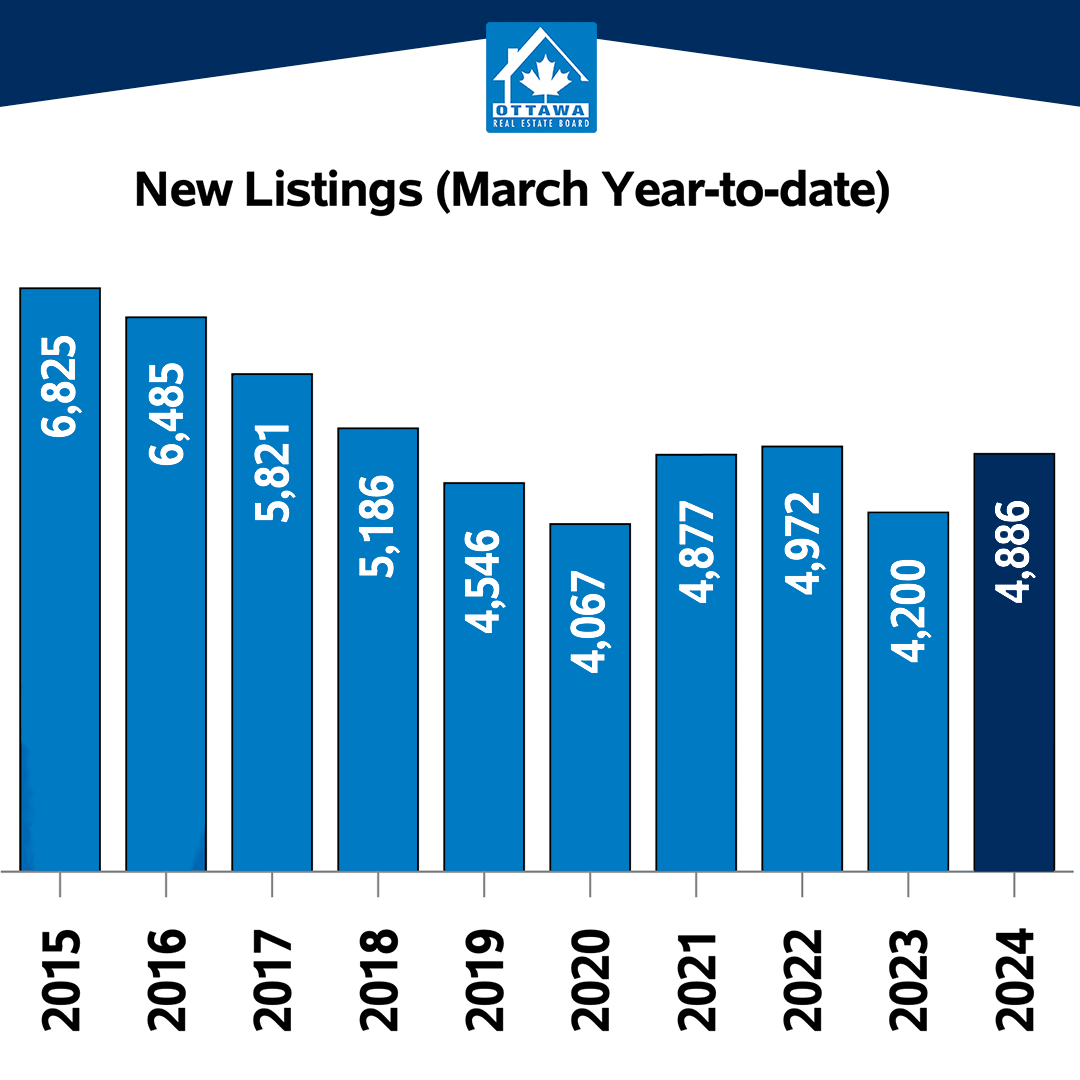
- The number of new listings saw an increase of 13.5% from March 2023. There were 2,074 new residential listings in March 2024. New listings were 2.3% below the five-year average and 11.1% below the 10-year average for the month of March.
- Active residential listings numbered 2,543 units on the market at the end of March 2024, a gain of 18.3% from March 2023. Active listings were 58.6% above the five-year average and 17.7% below the 10-year average for the month of March. Active listings haven’t been this high in the month of March in more than five years.
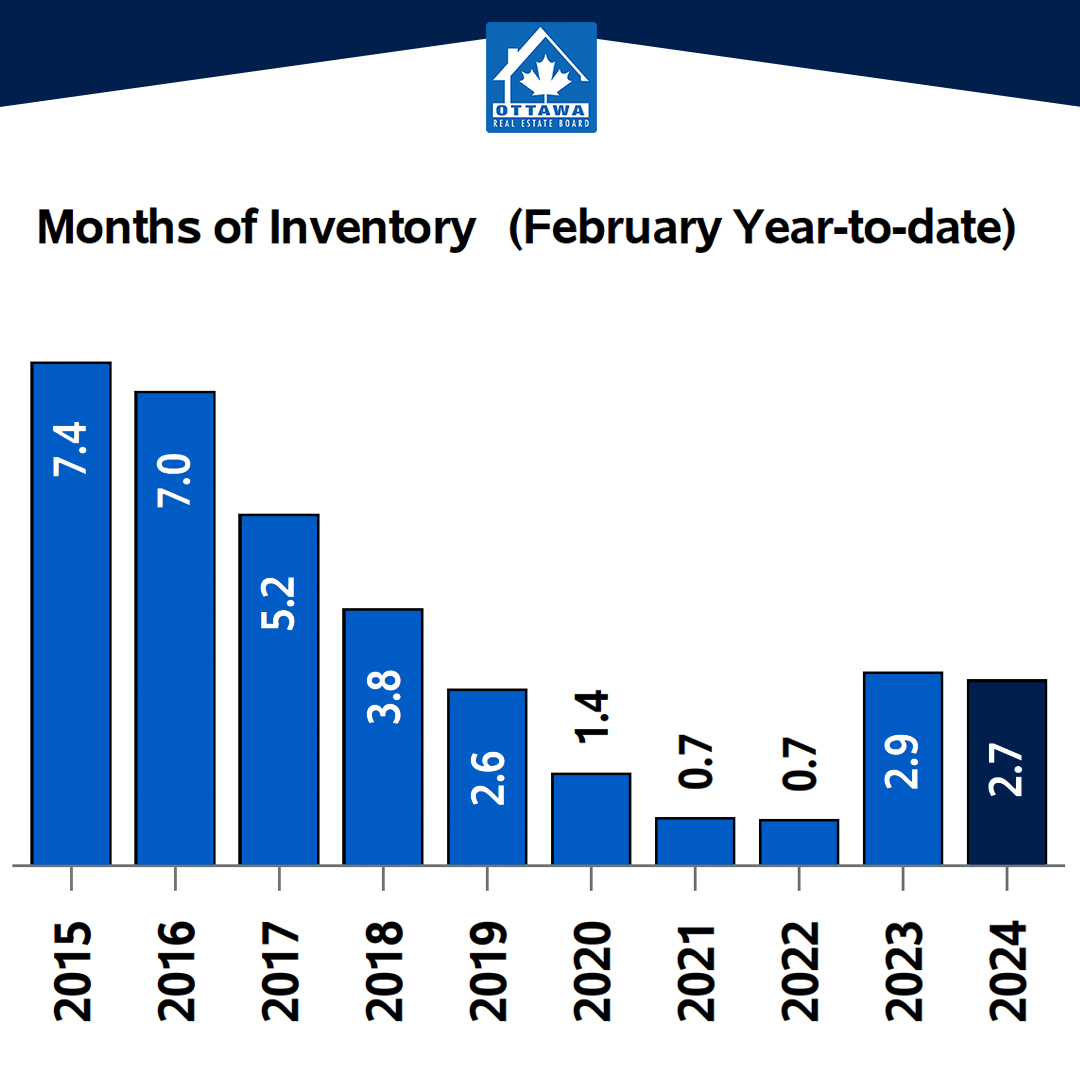
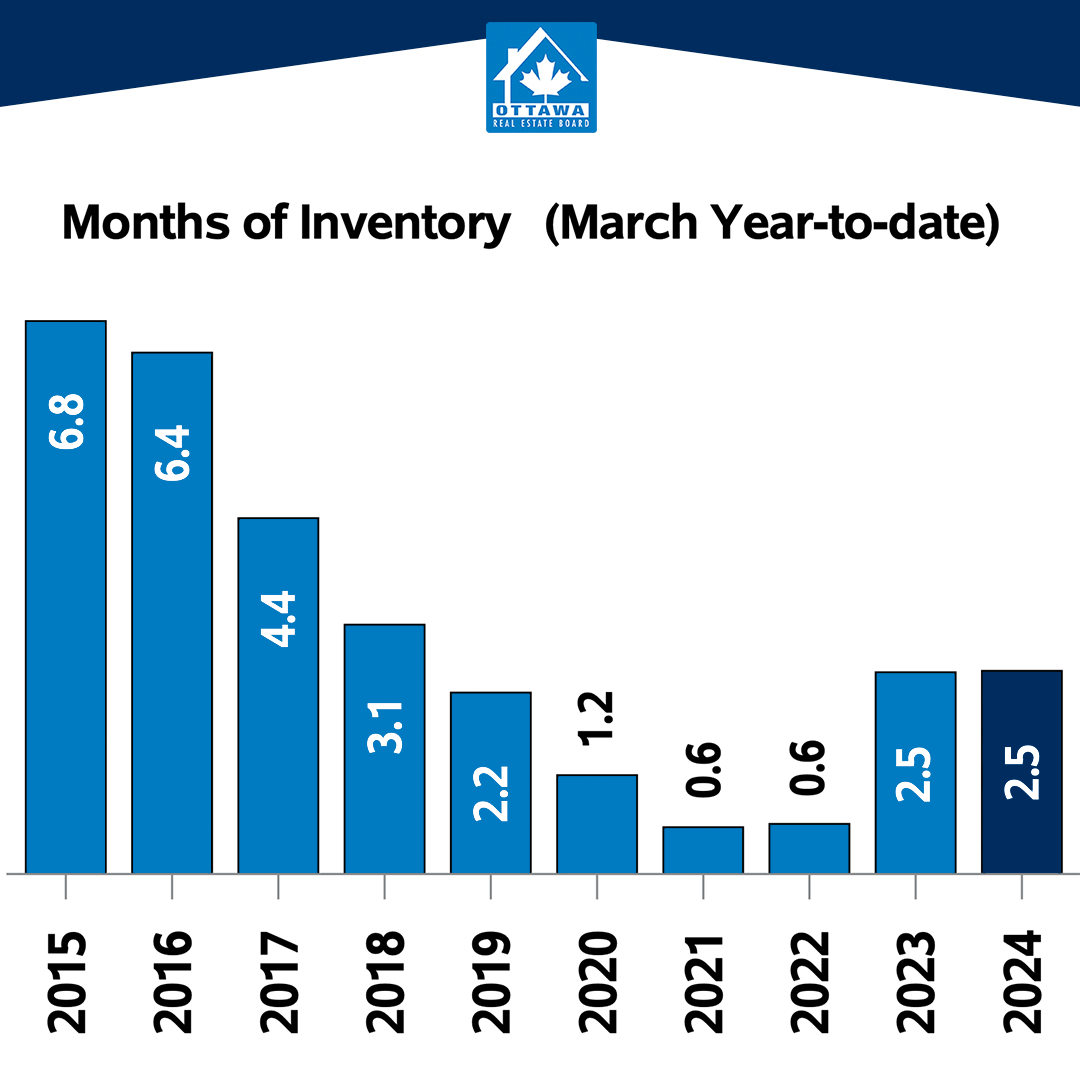
- Months of inventory numbered 2.2 at the end of March 2024, up only slight from 2 in March 2023 and below the long-run average of 2.6 months for this time of year. The number of months of inventory is the number of months it would take to sell current inventories at the current rate of sales activity.
In conjunction with the Ottawa Real Estate Board (OREB), historical data may be subject to revision moving forward. This could temporarily impact per cent change comparisons to data from previous years.
Distinctive Real Estate Advisors Inc., Brokerage is pleased to present a recap of the latest market forecast release and March highlights from the Ottawa Real Estate Board (OREB).
We’d welcome an opportunity to discuss the Ottawa’s MLS® Market Shows Early Signs of a Buzzing Spring Market. If you have any questions about our services, please contact our team.