Toronto Real Estate –

Distinctive Advisors Inc.

Menu

Distinctive Real Estate Advisors Inc., Brokerage | Distinctive Real Estate Advisors Inc., Mortgage Broker License #12592

Tag Archives: Toronto Real Estate

GTA REALTORS Release December and Year-End 2023 Stats

While the overall demand for housing remained buoyed by record immigration in 2023, more of this demand was pointed at the rental market. The number of Greater Toronto Area (GTA) home sales in 2023 came in at less than 70,000 due to affordability issues brought about by high mortgage rates.

High borrowing costs coupled with unrealistic federal mortgage qualification standards resulted in an unaffordable home ownership market for many households in 2023. With that said, relief seems to be on the horizon. Borrowing costs are expected to trend lower in 2024. Lower mortgage rates coupled with a relatively resilient economy should see a rebound in home sales this year.

RESIDENTIAL STATS

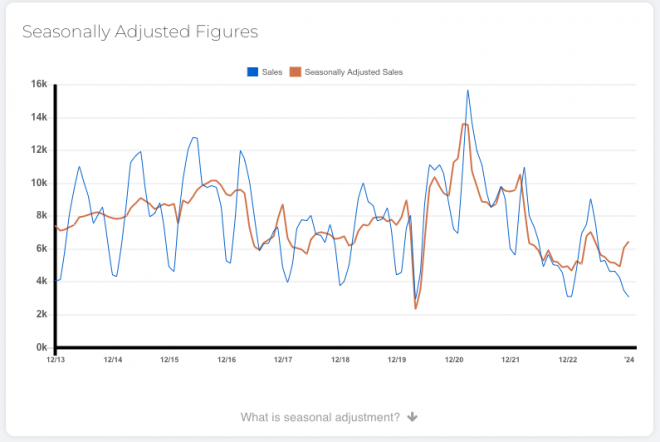
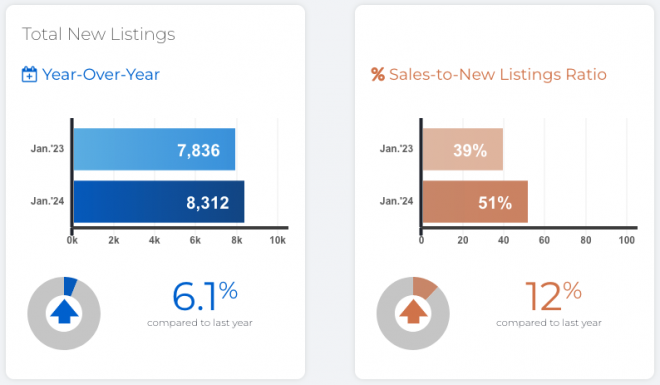
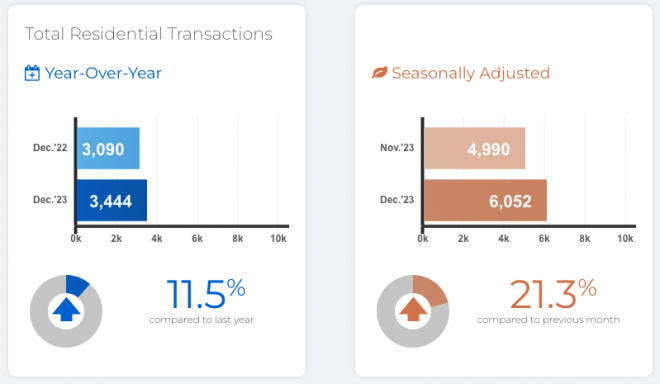
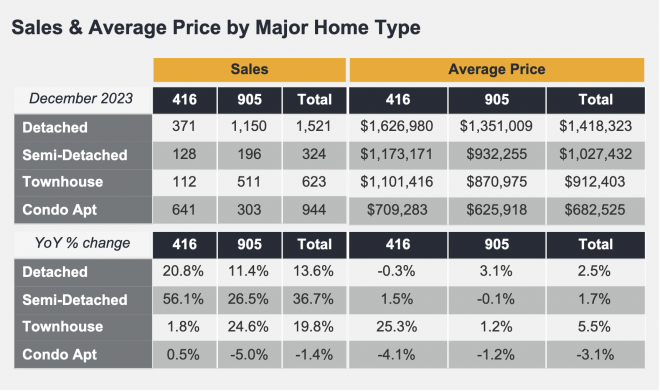
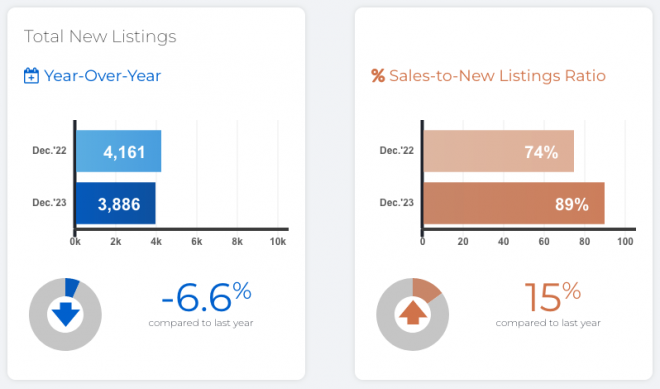
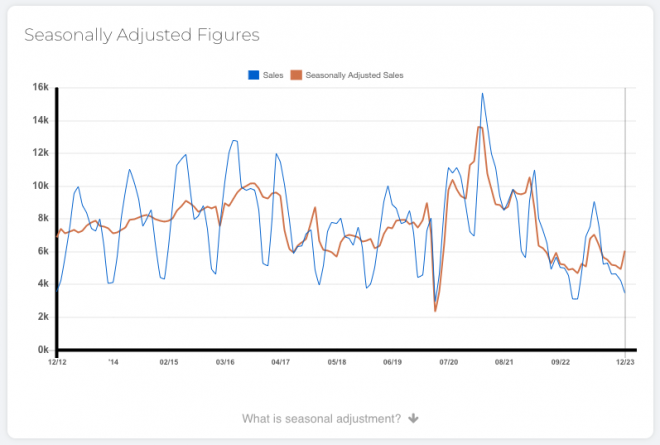
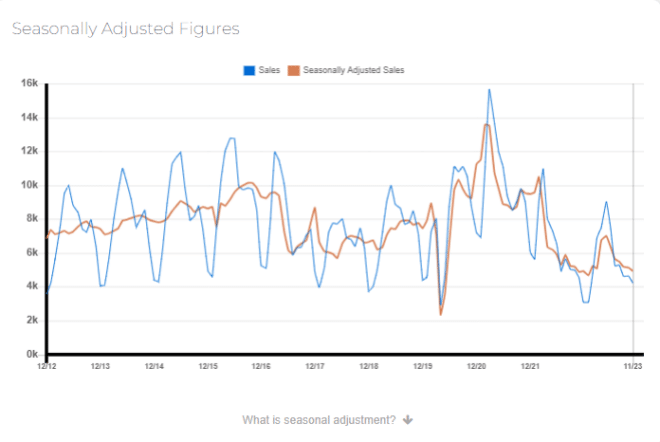
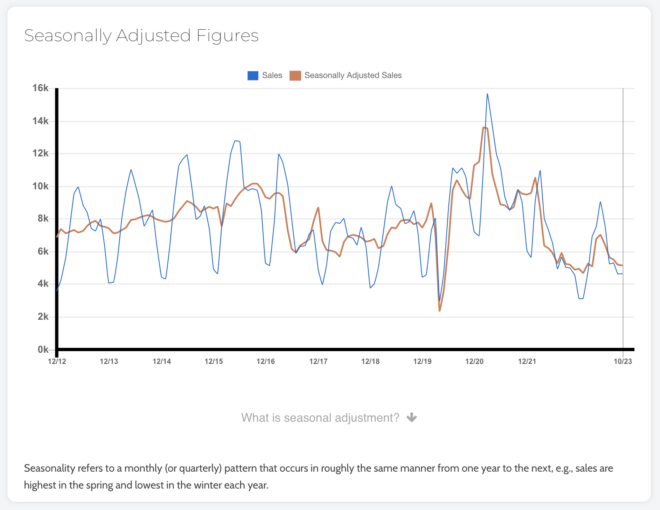
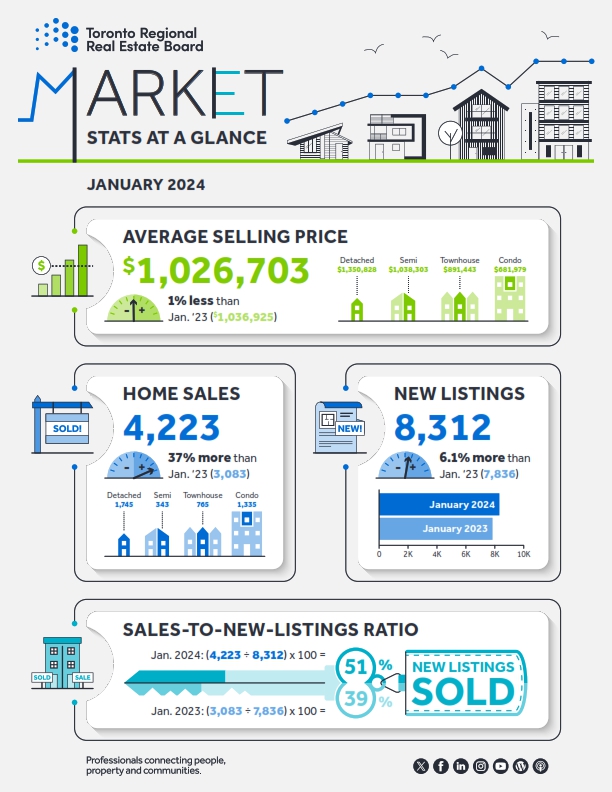
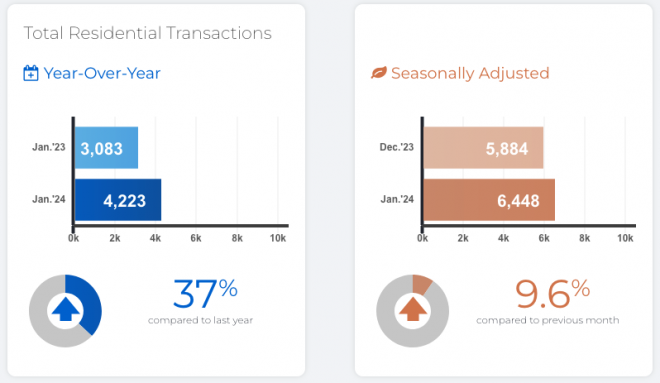
There were 65,982 home sales reported through TRREB’s MLS® System in 2023 – a 12.1 per cent dip compared to 2022. Despite an uptick during the spring and summer, the number of new listings also declined in 2023. The trend for listings has been largely flat-to-down over the past decade, which is problematic in the face of a steadily growing population. On a seasonally adjusted monthly basis, sales increased compared to November, while new listings declined for the third straight month.

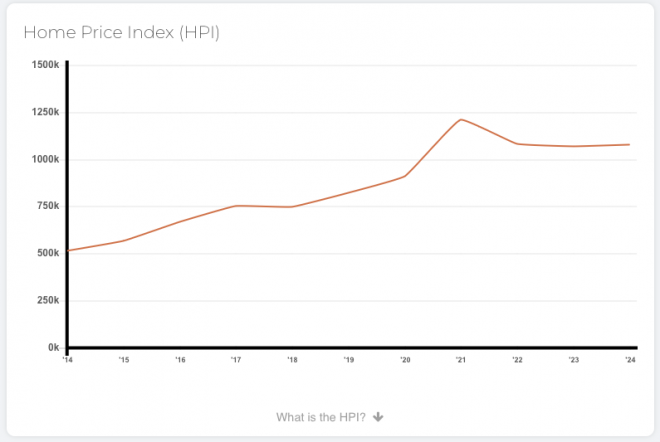
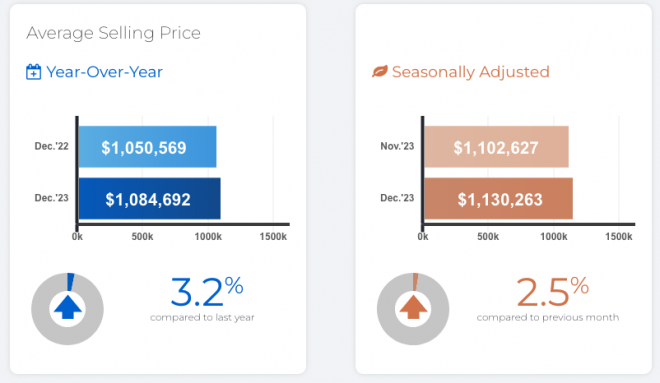
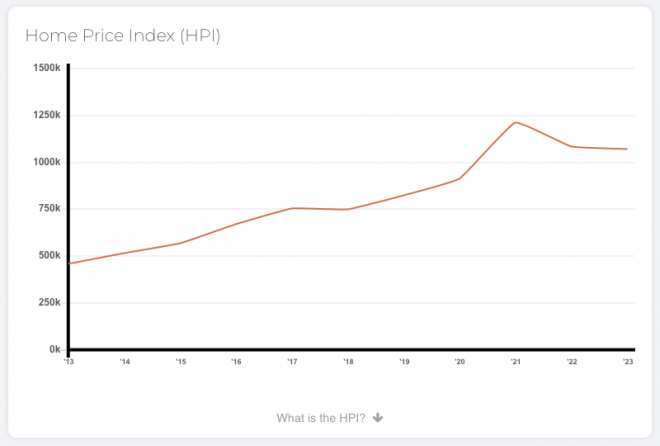
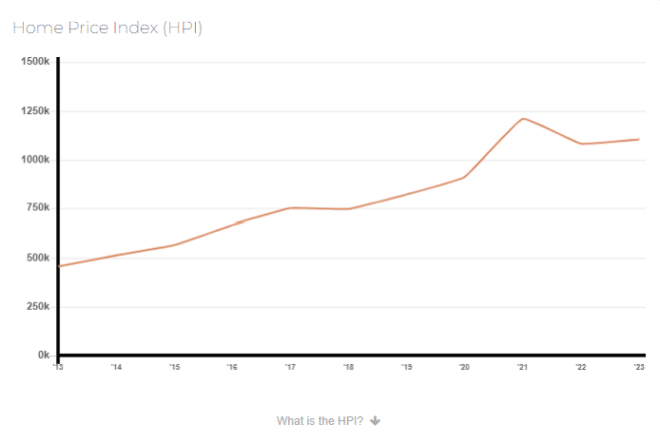
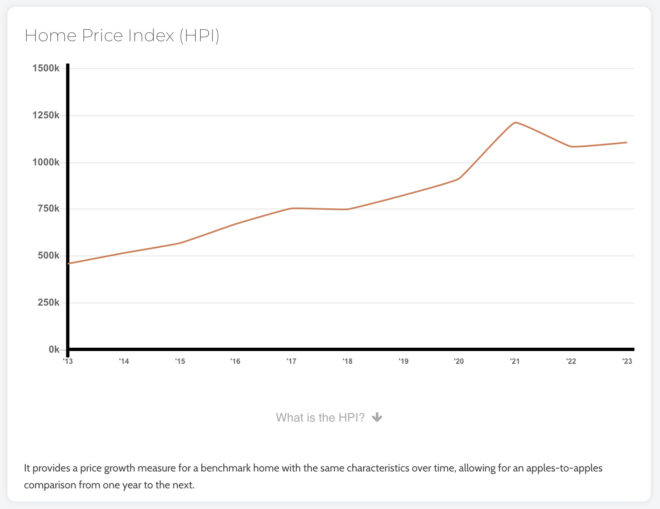
The average selling price for all home types in 2023 was $1,126,604, representing a 5.4 per cent decline compared to 2022. On a seasonally adjusted monthly basis, the average selling price edged higher, while the MLS® Home Price Index Composite edged lower.

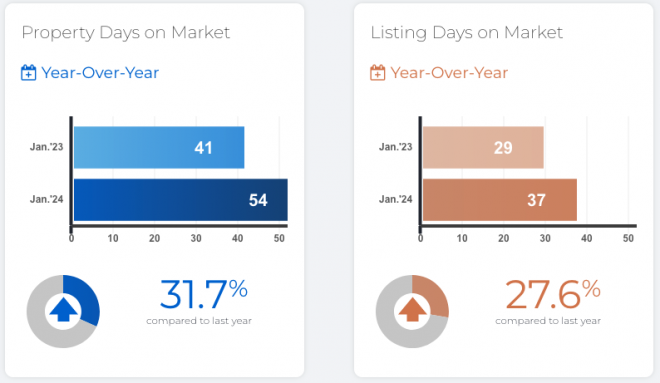
Buyers who were active in the market benefitted from more choice throughout 2023. This allowed many of these buyers to negotiate lower selling prices, alleviating some of the impact of higher borrowing costs. Assuming borrowing costs trend lower this year, look for tighter market conditions to prompt renewed price growth in the months ahead.

Record immigration into the GTA in the coming years will require a corresponding increase in the number of homes available to rent or purchase. People need to have comfort in knowing that they can plan their lives and future with the certainty that they will have the stability of an affordable place to live.

What is seasonal adjustment? Seasonality refers to a monthly (or quarterly) pattern that occurs in roughly the same manner from one year to the next, e.g., sales are highest in the spring and lowest in the winter each year.

What is seasonal adjustment? Seasonality refers to a monthly (or quarterly) pattern that occurs in roughly the same manner from one year to the next, e.g., sales are highest in the spring and lowest in the winter each year.

HPI provides a price growth measure for a benchmark home with the same characteristics over time, allowing for an apples-to-apples comparison from one year to the next.

HPI provides a price growth measure for a benchmark home with the same characteristics over time, allowing for an apples-to-apples comparison from one year to the next.

COMMERCIAL STATS

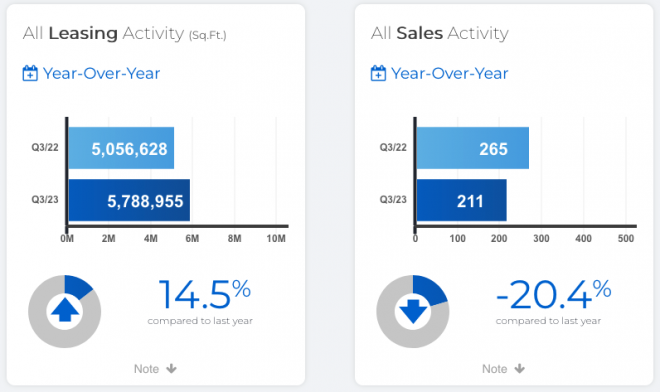
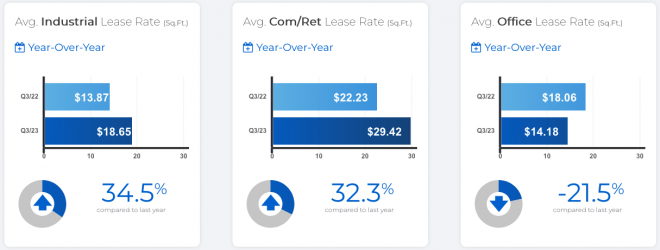
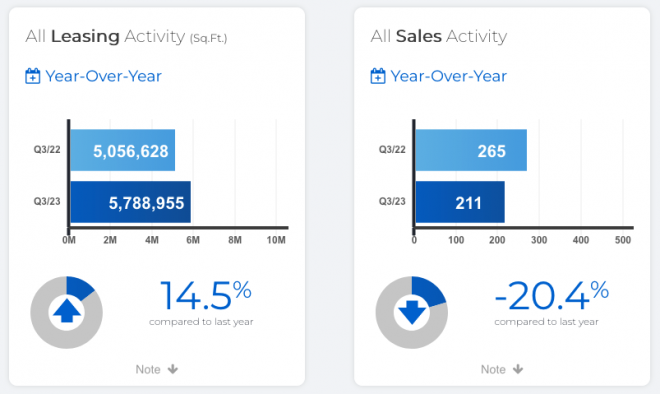
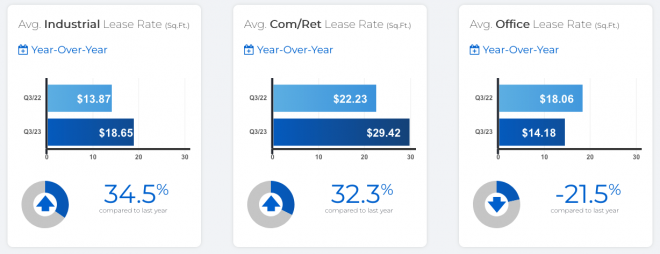
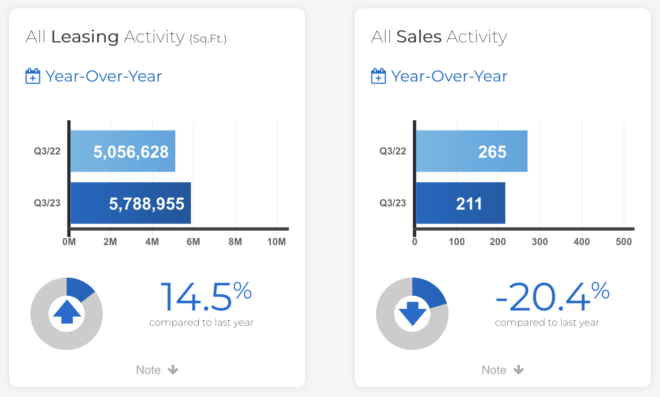
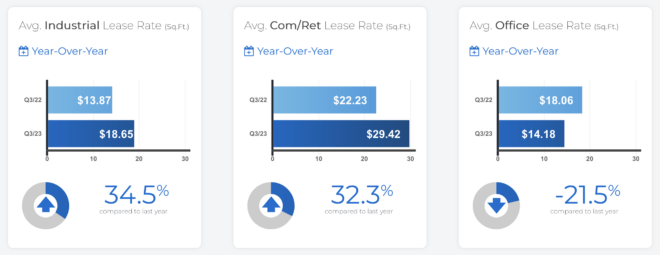
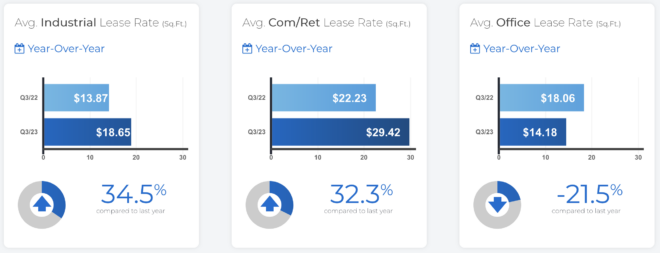
The “All Leasing Activity (Sq. Ft.)” chart summarizes total industrial, commercial/retail and office square feet leased through Toronto MLS® regardless of pricing terms.

The “All Sales Activity” chart summarizes total industrial and commercial/retail and office sales through Toronto MLS® regardless of pricing terms.

RESIDENTIAL CONDOMINIUM SALES STATS

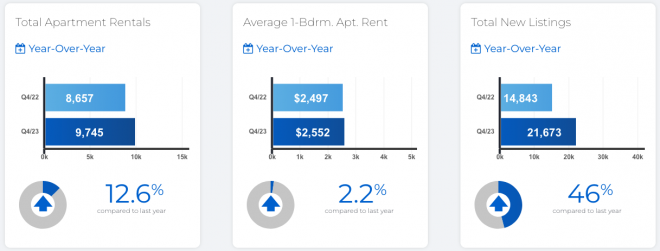
RESIDENTIAL CONDOMINIUM RENTAL STATS

In conjunction with the Toronto Regional Real Estate Board (TRREB) redistricting project, historical data may be subject to revision moving forward. This could temporarily impact per cent change comparisons to data from previous years.

Distinctive Real Estate Advisors Inc., Brokerage is pleased to present a recap of the latest market forecast release and December highlights from the Toronto Regional Real Estate Board (TRREB).

We’d welcome an opportunity to discuss the GTA REALTORS Release December and Year-End 2023 Stats. If you have any questions about our services, please contact our team.
Elevated Borrowing Costs Taking a Toll on Housing Affordability

High borrowing costs and uncertain economic conditions continued to weigh on Greater Toronto Area (GTA) home sales in November 2023.

The Toronto Regional Real Estate Board (TRREB) stated earlier today that sales were down on a year-over-year basis, while listings were up from last year’s trough in supply. With more choice in the market, selling prices remained basically flat year-over-year. This has been no more apparent than in the interest rate-sensitive housing market. However, it does appear relief is on the horizon. Bond yields, which underpin fixed rate mortgages have been trending lower and an increasing number of forecasters are anticipating Bank of Canada rate cuts in the first half of 2024. Lower rates will help alleviate affordability issues for existing homeowners and those looking to enter the market.

RESIDENTIAL STATS

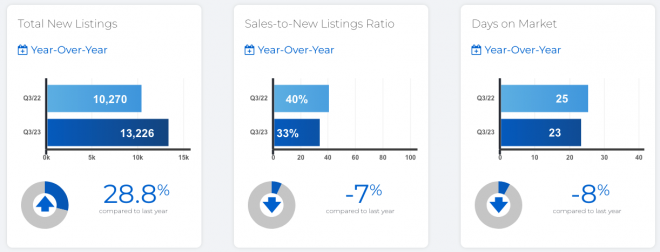
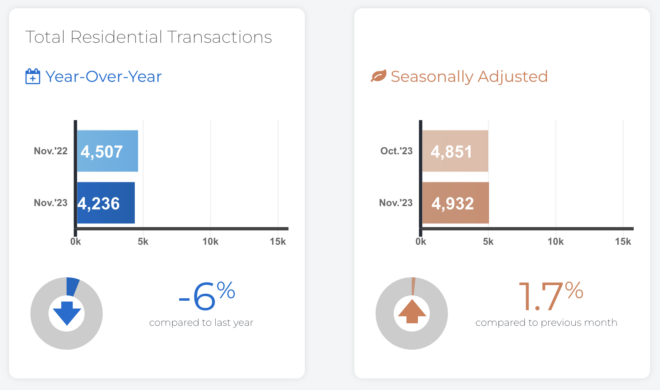
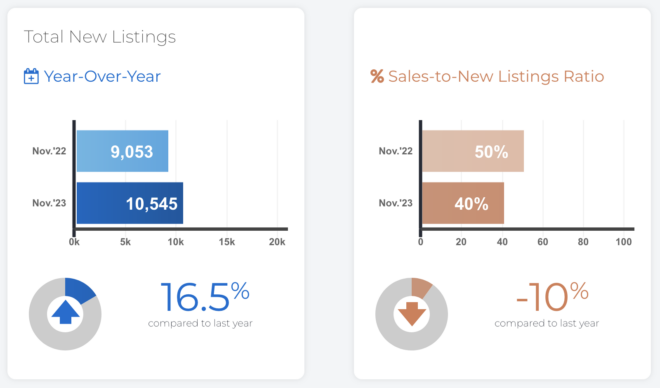
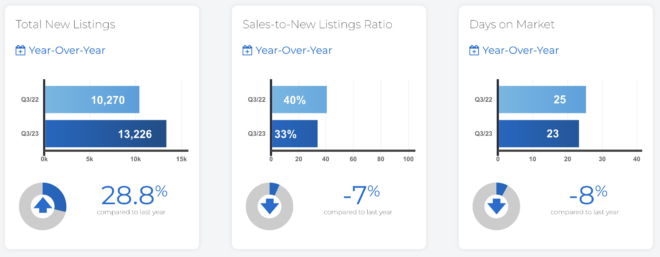
In November 2023, GTA REALTORS® reported 4,236 sales through TRREB’s MLS® System – a 6% decline compared to November 2022. Over the same period, the number of new listings was up by 16.5%. On a seasonally adjusted monthly basis, sales edged up compared to October 2023, while new listings were down by 5.5%.

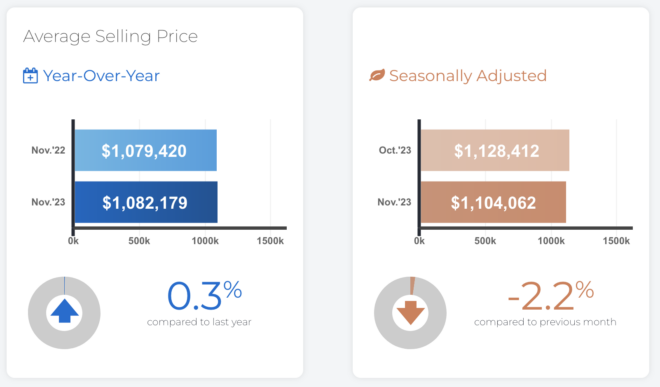
Home prices have adjusted from their peak in response to higher borrowing costs. This has provided some relief for buyers, from an affordability perspective.

As mortgage rates trend lower next year and the population continues to grow at a record pace, expect demand to increase relative to supply. This will eventually lead to renewed growth in home prices.

What is seasonal adjustment? Seasonality refers to a monthly (or quarterly) pattern that occurs in roughly the same manner from one year to the next, e.g., sales are highest in the spring and lowest in the winter each year.

HPI provides a price growth measure for a benchmark home with the same characteristics over time, allowing for an apples-to-apples comparison from one year to the next.


COMMERCIAL STATS

The “All Leasing Activity (Sq. Ft.)” chart summarizes total industrial, commercial/retail and office square feet leased through Toronto MLS® regardless of pricing terms.

The “All Sales Activity” chart summarizes total industrial and commercial/retail and office sales through Toronto MLS® regardless of pricing terms.

RESIDENTIAL CONDOMINIUM SALES STATS

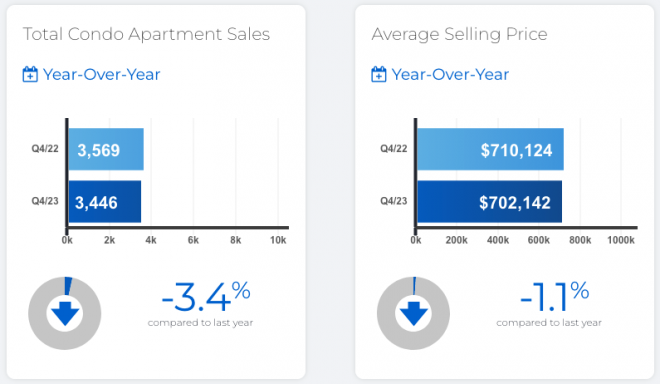
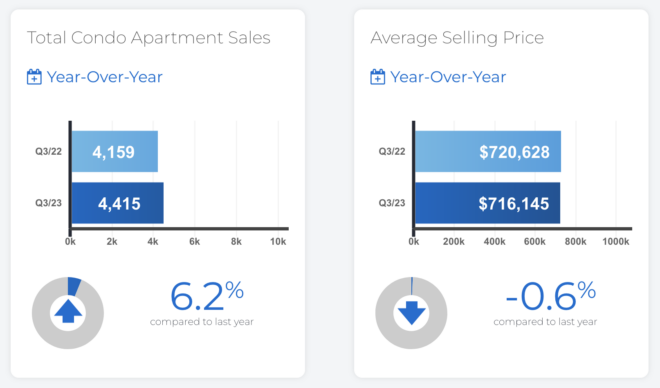
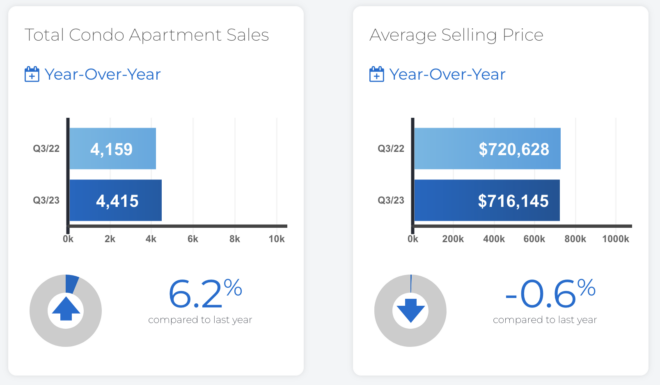
The condominium apartment market is an important entry point into home ownership for first-time buyers. A better-supplied market has led to more choice for these buyers, resulting in more negotiation power and lower selling prices on average. A pause in price growth has helped mitigate the impact of higher monthly mortgage payments.

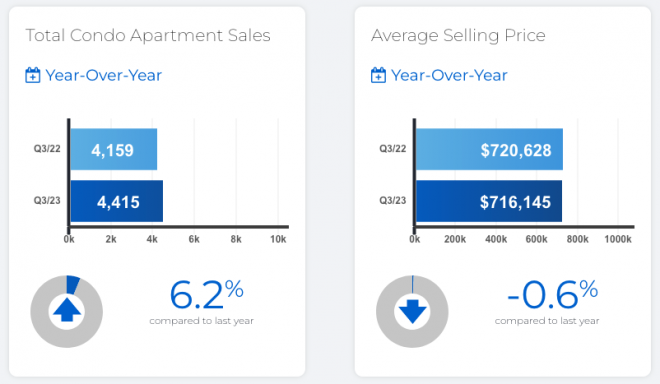
in the third quarter of 2023, the average selling price for a condominium apartment GTA-wide was $716,145 – down slightly compared to $720,628 in Q3-2022. In the City of Toronto, which accounted for approximately two-thirds of condo apartment sales, the average selling price was $736,566 – down from $750,087 in Q3-2022. While condo market conditions have become more balanced over the past year-and a-half, we will likely start to see a tightening in the market in the second half of 2024.

The GTA population is growing at a record pace and the consensus view is that we will start to see some relief in terms of borrowing costs beginning in 2024 and even more so in 2025.

RESIDENTIAL CONDOMINIUM RENTAL STATS

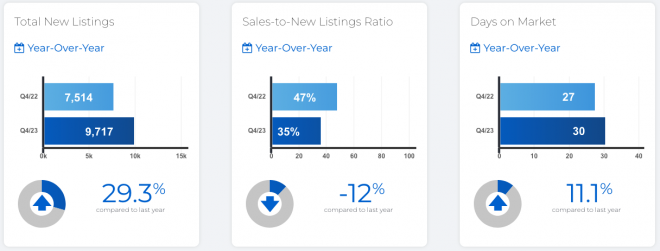
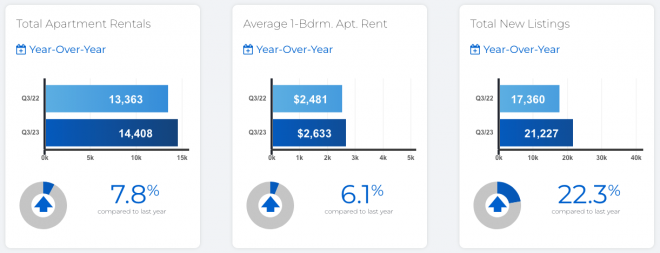
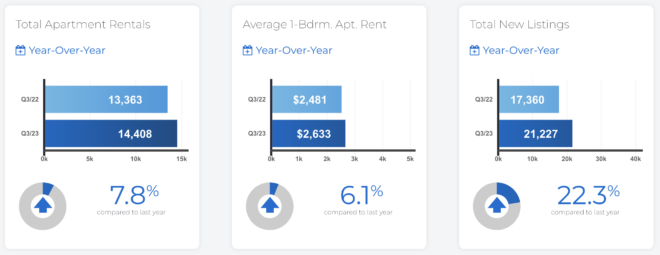
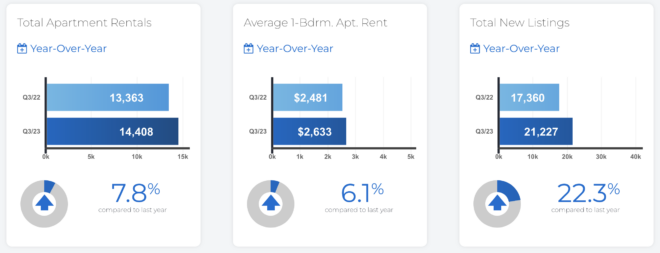
Strong population growth and high borrowing costs continued to drive demand for GTA rental housing in the third quarter. Would-be first-time buyers, who have seen affordability erode over the past year-and-a-half due to high mortgage rates, have remained in the rental market. Many new permanent and temporary residents have also turned to the rental market for housing. Renters can expect this trend to continue for the foreseeable future, underpinning the need for a sustainable pipeline of rental housing supply.

The supply of units for rent has increased at a faster pace than rental transactions over the past year. Many investor-owned units have been listed for rent, in response to very strong rent growth and, quite possibly, the actual or potential introduction of tighter regulations surrounding vacant units and short-term rentals. However, despite a better-supplied market, competition between renters has remained strong enough to sustain above-inflation rent increases.

In conjunction with the Toronto Regional Real Estate Board (TRREB) redistricting project, historical data may be subject to revision moving forward. This could temporarily impact per cent change comparisons to data from previous years.

Distinctive Real Estate Advisors Inc., Brokerage is pleased to present a recap of the latest market forecast release and November highlights from the Toronto Regional Real Estate Board (TRREB).

We’d welcome an opportunity to discuss the Elevated Borrowing Costs Taking a Toll on Housing Affordability. If you have any questions about our services, please contact our team.
GTA REALTORS® Release October 2023 Stats

  • Lack of affordability and uncertainty remained issues for many would-be home buyers in the Greater Toronto Area (GTA) in October 2023. As a result, sales edged lower compared to last year.
  • Selling prices remained higher than last year’s levels. Record population growth and a relatively resilient GTA economy have kept the overall demand for housing strong.
  • More of that demand has been pointed at the rental market, as high borrowing costs and uncertainty on the direction of interest rates has seen many would-be home buyers remain on the sidelines in the short term. When mortgage rates start trending lower, home sales are predicted to pick up quickly.

RESIDENTIAL STATS

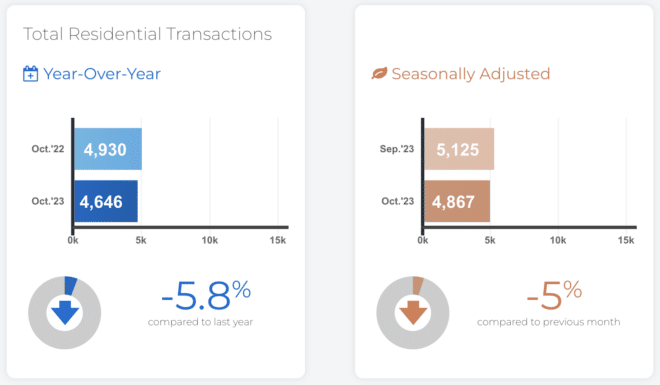
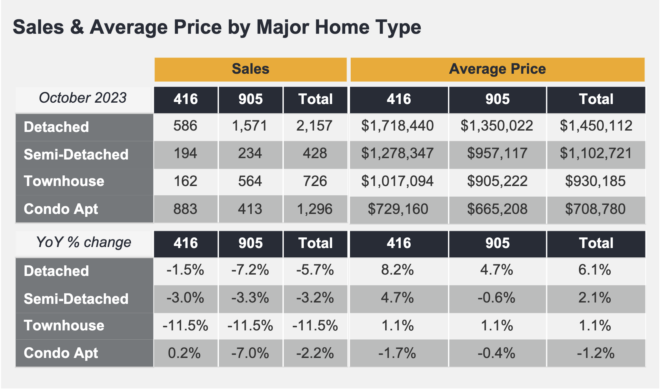
REALTORS® reported 4,646 GTA home sales through TRREB’s MLS® System in October 2023 – down 5.8 per cent compared to October 2022. On a month-over-month seasonally-adjusted basis, sales were also down in comparison to September.

New listings in October 2023 were up noticeably compared to the 12-year low reported in October 2022, but up more modestly compared to the 10-year average for October. New listings, on a seasonally adjusted basis, edged slightly lower month-over-month compared to September 2023.

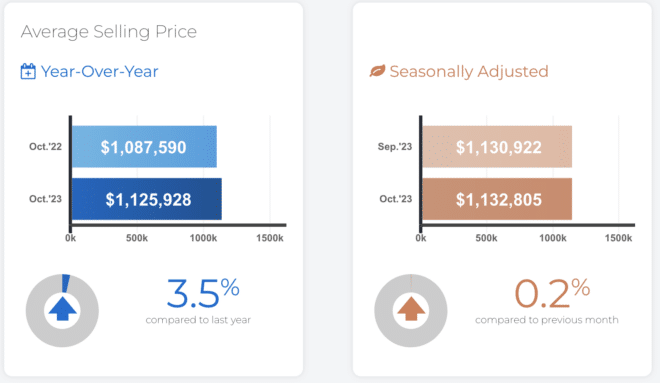
The October 2023 MLS® Home Price Index Composite benchmark and the average selling price were both up on year-over-year basis, by 1.4 per cent and 3.5 per cent respectively. On a seasonally adjusted basis, the MLS® HPI Composite benchmark edged lower compared to September 2023 while the average selling price remained at a similar level. Both the MLS® HPI Composite benchmark and average price remained above the cyclical lows experienced at the beginning of 2023.


Competition between buyers remained strong enough to keep the average selling price above last year’s level in October and above the cyclical lows experienced in the first quarter of this year. The Bank of Canada also noted this resilience in its October statement. However, home prices remain well-below their record peak reached at the beginning of 2022, so lower home prices have mitigated the impact of higher borrowing costs to a certain degree.

In the current environment of extremely high borrowing costs, it is disappointing to see that there has been no relief for uninsured mortgage holders reaching the end of their current term. If these borrowers want to shop around for a more competitive rate, they are still forced to unrealistically qualify at rates approaching eight per cent. Following their most recent round of consultations, the Office of the Superintendent of Financial Institutions should have eliminated this qualification rule for those renewing their mortgages with a different institution.

CONDO SALE STATS

CONDO RENTAL STATS

COMMERCIAL STATS

The “All Leasing Activity (Sq. Ft.)” chart summarizes total industrial, commercial/retail and office square feet leased through Toronto MLS® regardless of pricing terms.
The “All Sales Activity” chart summarizes total industrial and commercial/retail and office sales through Toronto MLS® regardless of pricing terms.

In conjunction with the Toronto Regional Real Estate Board (TRREB) redistricting project, historical data may be subject to revision moving forward. This could temporarily impact per cent change comparisons to data from previous years.

Distinctive Real Estate Advisors Inc., Brokerage is pleased to present a recap of the latest market forecast release and October highlights from the Toronto Regional Real Estate Board (TRREB).

We’d welcome an opportunity to discuss the GTA Realtors Release October 2023 Stats. If you have any questions about our services, please contact our team.
High Interest Rates Impacting the Market, But Population Growth Will Soon Spur Demand

  • The impact of high borrowing costs, high inflation, uncertainty surrounding future Bank of Canada decisions and slower economic growth continued to weigh on Greater Toronto Area (GTA) home sales in September.
  • Despite the market being better-supplied with listings, the average selling price was up year-over-year.The short and medium-term outlooks for the GTA housing market are very different. In the short term, the consensus view is that borrowing costs will remain elevated until mid-2024, after which they will start to trend lower.
  • This suggests that we should start to see a marked uptick in demand for ownership housing in the second half of next year, as lower rates and record population growth spur an increase in buyers.
RESIDENTIAL STATS

In September 2023, GTA REALTORS® reported 4,642 home sales through TRREB’s MLS® System in September 2023 – down 7.1% compared to September 2022.

The year-over-year dip in sales was more pronounced for ground-oriented homes, particularly semi-detached houses and townhouses. On a month-over-month seasonally-adjusted basis, sales were also down slightly.

GTA home selling prices remain above the trough experienced early in the first quarter of 2023. However, we did experience a more balanced market in the summer and early fall, with listings increasing noticeably relative to sales.

This suggests that some buyers may benefit from more negotiating power, at least in the short term. This could help offset the impact of high borrowing cost.
What is seasonal adjustment? Seasonality refers to a monthly (or quarterly) pattern that occurs in roughly the same manner from one year to the next, e.g., sales are highest in the spring and lowest in the winter each year.
COMMERCIAL STATS

The “All Leasing Activity (Sq. Ft.)” chart summarizes total industrial, commercial/retail and office square feet leased through Toronto MLS® regardless of pricing terms.
The “All Sales Activity” chart summarizes total industrial and commercial/retail and office sales through Toronto MLS® regardless of pricing terms.

In conjunction with the Toronto Regional Real Estate Board (TRREB) redistricting project, historical data may be subject to revision moving forward. This could temporarily impact per cent change comparisons to data from previous years.

Distinctive Real Estate Advisors Inc., Brokerage is pleased to present a recap of the latest market forecast release and September highlights from the Toronto Regional Real Estate Board (TRREB).

We’d welcome an opportunity to discuss the High Interest Rates Impacting the Market, but Population Growth will Soon Spur Demand. If you have any questions about our services, please contact our team.
« Older Entries

Newer Entries »