Toronto Rental Stats –

Distinctive Advisors Inc.

Menu

Distinctive Real Estate Advisors Inc., Brokerage | Distinctive Real Estate Advisors Inc., Mortgage Broker License #12592

Tag Archives: Toronto Rental Stats

Tighter Market Conditions in January 2024 Compared to the Previous Year

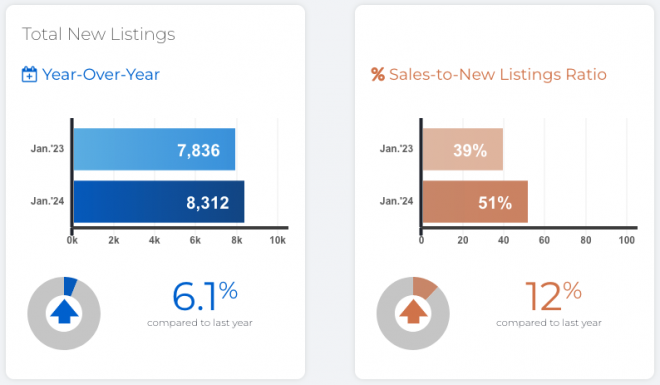
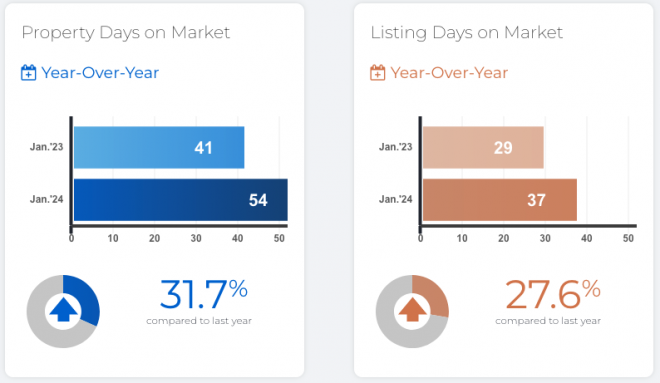
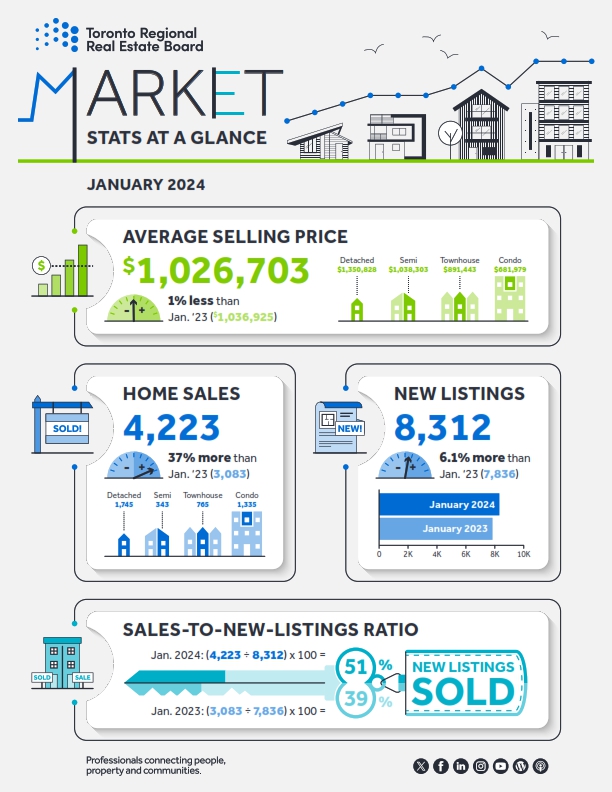
Home sales in January 2024 increased compared to January 2023, driven by lower borrowing costs for fixed-rate mortgages. This surge, along with a rise in new listings, indicates tighter market conditions and potential for price growth into the spring.

TRREB President Jennifer Pearce credits this positive start to expectations of decreasing inflation and interest rates, boosting buyer confidence, especially for first-time buyers challenged by high rents.

RESIDENTIAL STATS

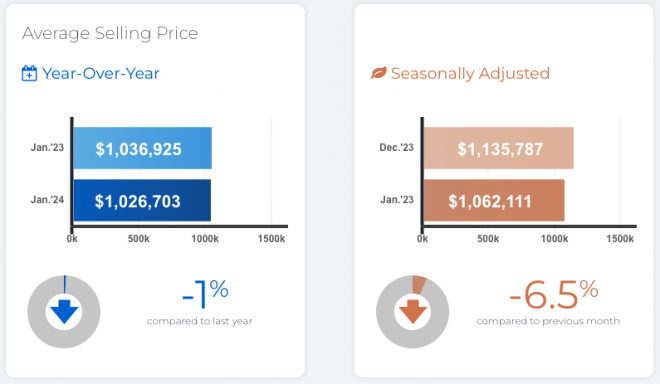
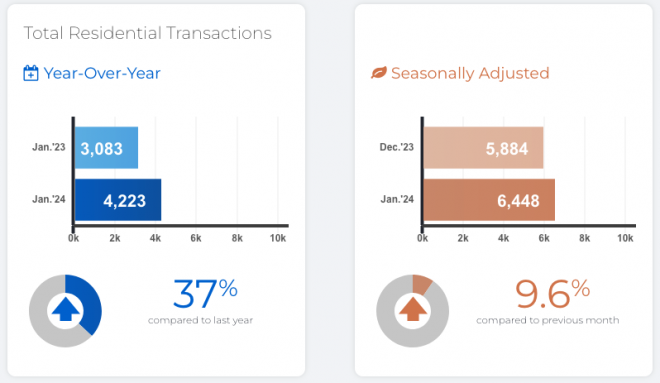
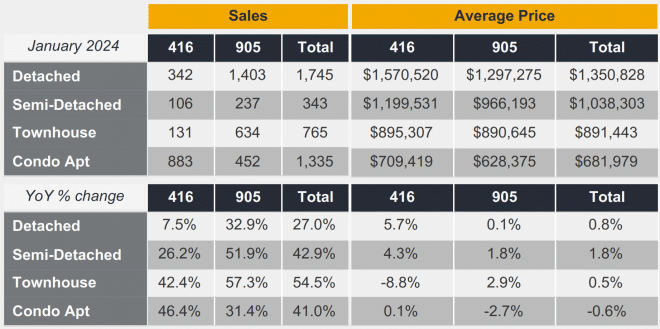
January saw 4,223 sales through TRREB’s MLS® System, a significant jump from the previous year, with sales growth outpacing new listings. This tightening of market conditions suggests increased competition and potential price increases in the coming years.

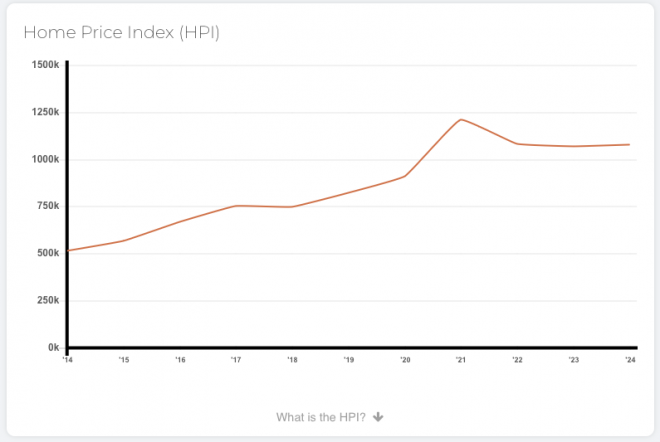
Despite a slight decline in the MLS® Home Price Index Composite and average selling price year-over-year, the outlook remains optimistic with anticipated policy rate cuts by the Bank of Canada. However, addressing policy issues at federal, provincial, and municipal levels, including the mortgage stress test and housing supply, is crucial for sustained market improvement and affordability.
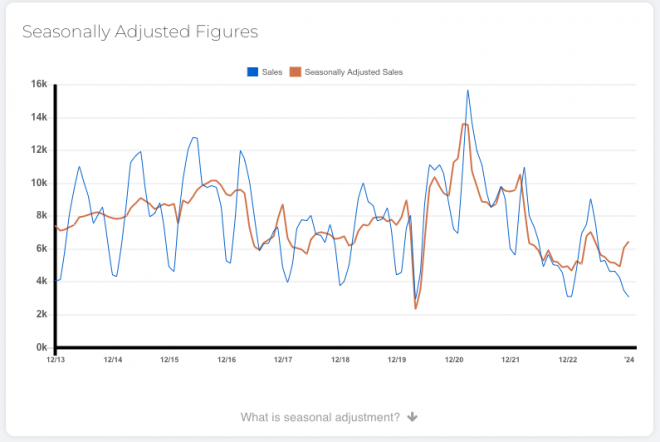
What is seasonal adjustment? Seasonality refers to a monthly (or quarterly) pattern that occurs in roughly the same manner from one year to the next, e.g., sales are highest in the spring and lowest in the winter each year.

HPI provides a price growth measure for a benchmark home with the same characteristics over time, allowing for an apples-to-apples comparison from one year to the next.

COMMERCIAL STATS

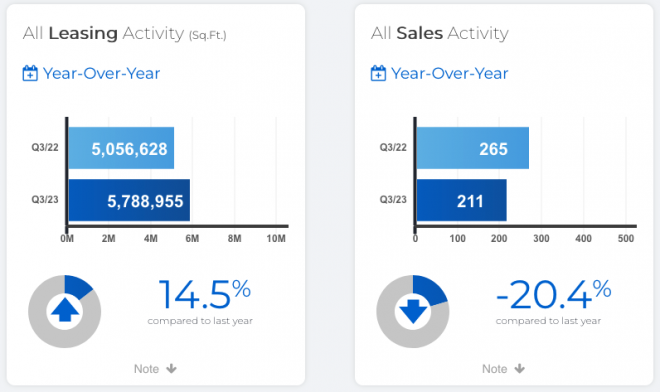
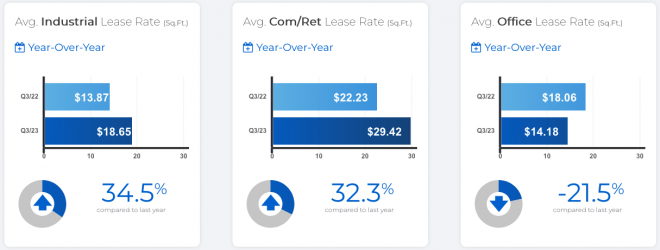
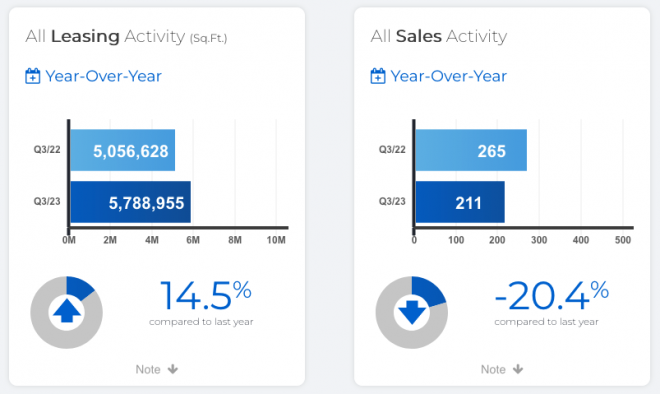
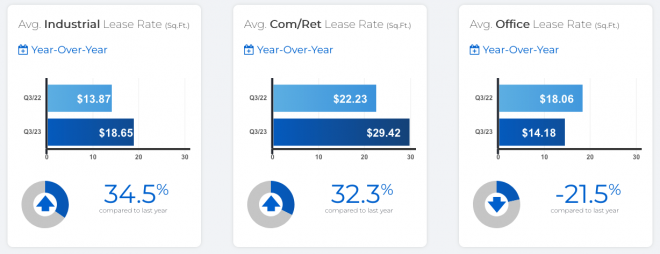
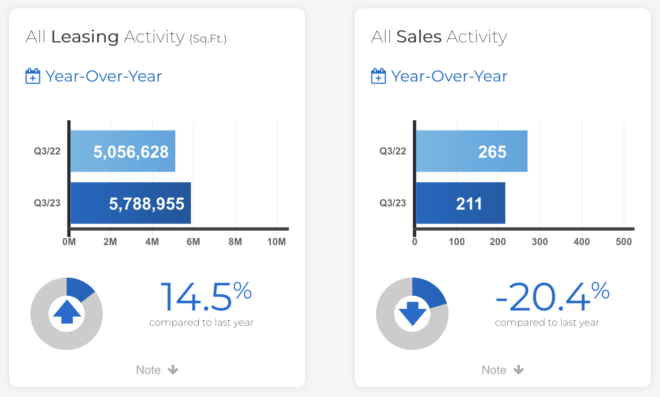
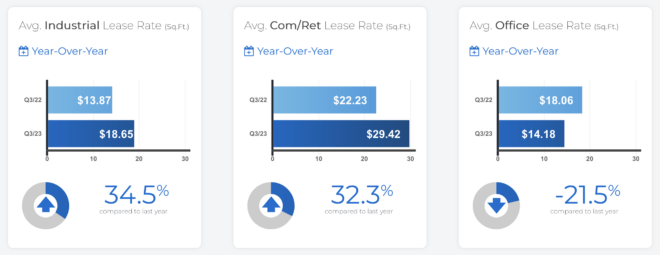
In Q3 2023, TRREB Commercial Network Members reported a significant leasing activity with nearly 5.8 million square feet of space leased across industrial, commercial/retail, and office sectors, marking an increase from Q3 2022. Notably, the average lease rates for industrial and commercial/retail spaces saw a year-over-year rise, with industrial rates jumping to $18.65 per square foot from $13.87, and commercial/retail rates to $29.42 from $22.23. Conversely, the average office lease rate decreased to $14.18 per square foot from $18.06, reflecting the evolving dynamics of the market and the varied mix of properties leased.

Commercial sales, however, experienced a downturn, totaling 211 transactions in Q3 2023, down from 265 in the same quarter the previous year. This decline was observed across all sectors, with industrial sales dropping to 97, commercial/retail to 90, and office sales to 50.

The commercial real estate market continues to be influenced by the lingering effects of the COVID-19 pandemic, such as the rise in remote working and shifts in retail trade, alongside the broader economic implications of higher borrowing costs. These factors collectively shape the demand and transaction dynamics in the commercial real estate landscape.

The “All Leasing Activity (Sq. Ft.)” chart summarizes total industrial, commercial/retail and office square feet leased through Toronto MLS®regardless of pricing terms.

The “All Sales Activity” chart summarizes total industrial and commercial/retail and office sales through Toronto MLS® regardless of pricing terms.

RESIDENTIAL CONDOMINIUM SALES STATS

As as January 31, 2024, the Greater Toronto Area (GTA) witnessed a historic low in condominium apartment sales for the fourth quarter of 2023, influenced by high borrowing costs affecting affordability. Despite this, active buyers enjoyed a wide selection, leading to slightly lower average selling prices compared to the same period in 2022.

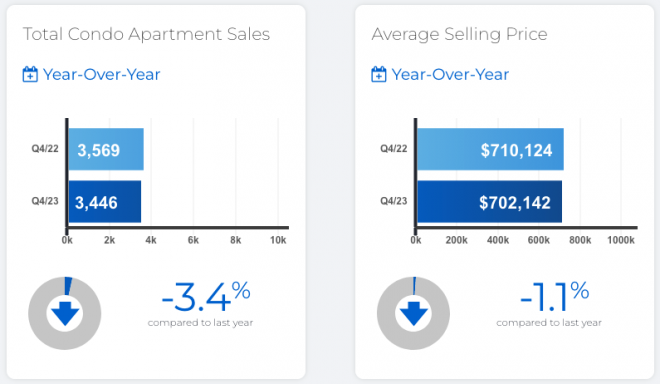
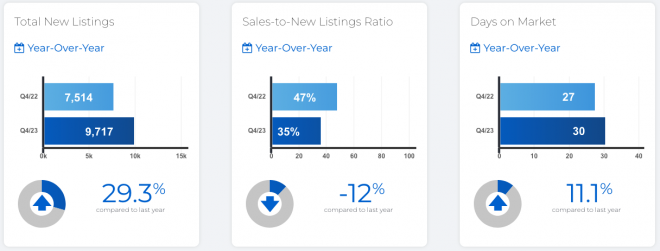
Condo sales totaled 3,446 in Q4 2023, a 3.4% decrease year-over-year, while listings surged by over 29%. This discrepancy resulted in a more balanced market. The average condo selling price in the GTA stood at $702,142, a 1.1% decline from $710,124 in Q4 2022. In Toronto, the average price fell to $720,456, marking a 2.4% decrease from the previous quarter.

TRREB Chief Market Analyst Jason Mercer noted that condo prices have remained stable over the past year, with buyers wielding significant negotiating power due to abundant supply. With anticipated lower borrowing costs and high rents, demand for condos is expected to rise in 2024, positioning them as a vital entry point to homeownership.

RESIDENTIAL CONDOMINIUM RENTAL STATS

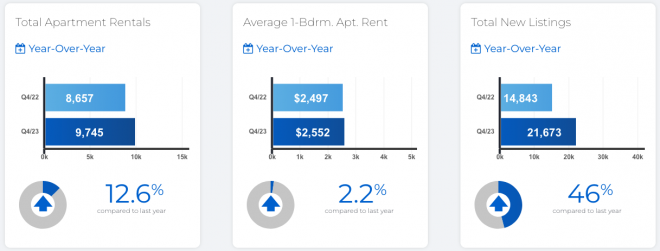
Condominium apartment leasing in the GTA saw robust activity in Q4 2023, with lease transactions via TRREB’s MLS® marking a significant 12.6% year-over-year increase, totaling 9,745. Listings for rent also rose, but at a faster rate of 46%, offering renters more options and moderating rent growth compared to earlier in the year.

TRREB President Jennifer Pearce highlighted the sustained demand for rental housing, fueled by population growth from immigration and non-permanent migration. Despite high borrowing costs deterring potential homebuyers, the rental market remains tight. Yet, an increase in rental listings in the latter half of 2023 has somewhat eased the pace of rent increases.

Average rents for one-bedroom and two-bedroom condominium apartments in Q4 2023 climbed to $2,552 and $3,267, respectively, marking rises of 2.2% and 3.7%. The GTA’s rental market is expected to stay competitive due to continued population growth, though the recent uptick in listings has provided some relief.

In conjunction with the Toronto Regional Real Estate Board (TRREB) redistricting project, historical data may be subject to revision moving forward. This could temporarily impact per cent change comparisons to data from previous years.

Distinctive Real Estate Advisors Inc., Brokerage is pleased to present a recap of the latest market forecast release and January highlights from the Toronto Regional Real Estate Board (TRREB).

We’d welcome an opportunity to discuss the Tighter Market Conditions in Jan-2024 Compared to Previous Year. If you have any questions about our services, please contact our team.
GTA REALTORS Release December and Year-End 2023 Stats

While the overall demand for housing remained buoyed by record immigration in 2023, more of this demand was pointed at the rental market. The number of Greater Toronto Area (GTA) home sales in 2023 came in at less than 70,000 due to affordability issues brought about by high mortgage rates.

High borrowing costs coupled with unrealistic federal mortgage qualification standards resulted in an unaffordable home ownership market for many households in 2023. With that said, relief seems to be on the horizon. Borrowing costs are expected to trend lower in 2024. Lower mortgage rates coupled with a relatively resilient economy should see a rebound in home sales this year.

RESIDENTIAL STATS

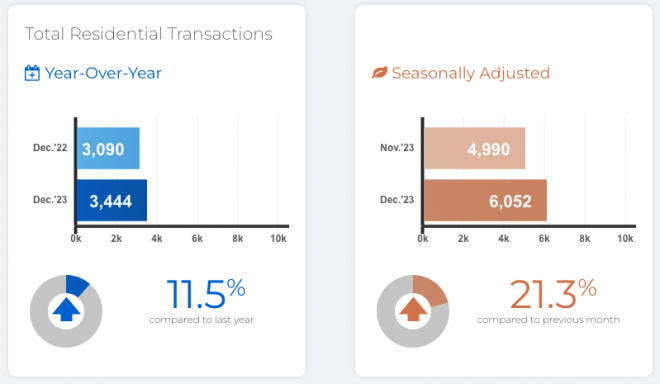
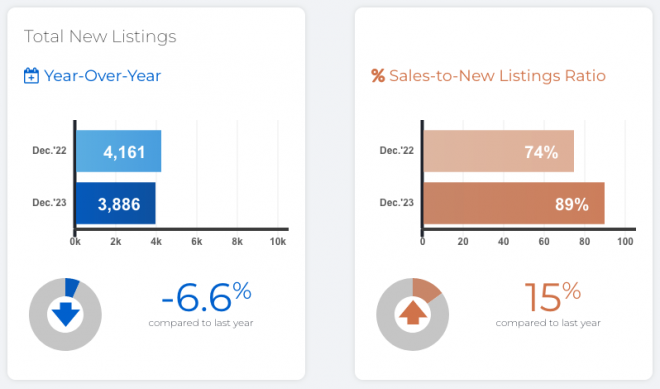
There were 65,982 home sales reported through TRREB’s MLS® System in 2023 – a 12.1 per cent dip compared to 2022. Despite an uptick during the spring and summer, the number of new listings also declined in 2023. The trend for listings has been largely flat-to-down over the past decade, which is problematic in the face of a steadily growing population. On a seasonally adjusted monthly basis, sales increased compared to November, while new listings declined for the third straight month.

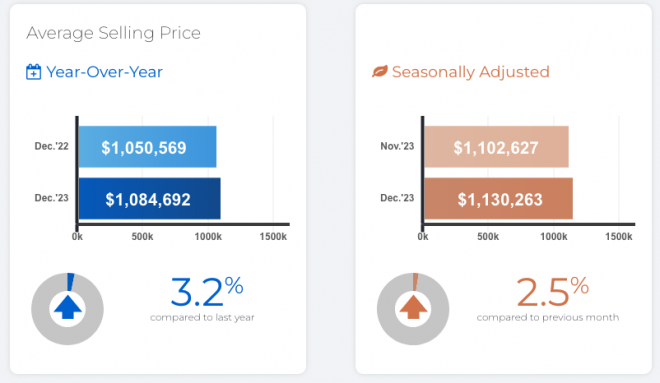
The average selling price for all home types in 2023 was $1,126,604, representing a 5.4 per cent decline compared to 2022. On a seasonally adjusted monthly basis, the average selling price edged higher, while the MLS® Home Price Index Composite edged lower.

Buyers who were active in the market benefitted from more choice throughout 2023. This allowed many of these buyers to negotiate lower selling prices, alleviating some of the impact of higher borrowing costs. Assuming borrowing costs trend lower this year, look for tighter market conditions to prompt renewed price growth in the months ahead.

Record immigration into the GTA in the coming years will require a corresponding increase in the number of homes available to rent or purchase. People need to have comfort in knowing that they can plan their lives and future with the certainty that they will have the stability of an affordable place to live.

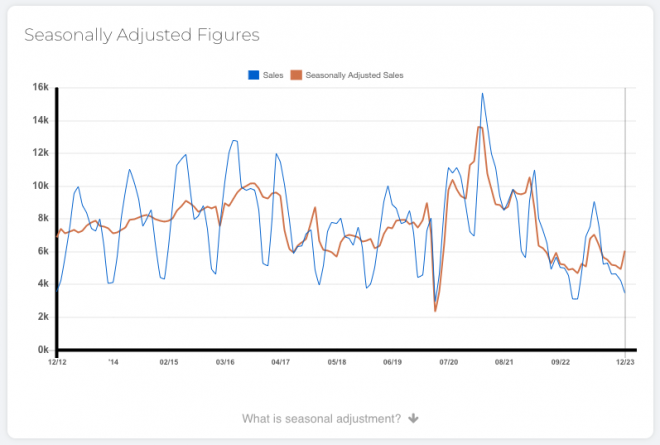
What is seasonal adjustment? Seasonality refers to a monthly (or quarterly) pattern that occurs in roughly the same manner from one year to the next, e.g., sales are highest in the spring and lowest in the winter each year.

What is seasonal adjustment? Seasonality refers to a monthly (or quarterly) pattern that occurs in roughly the same manner from one year to the next, e.g., sales are highest in the spring and lowest in the winter each year.

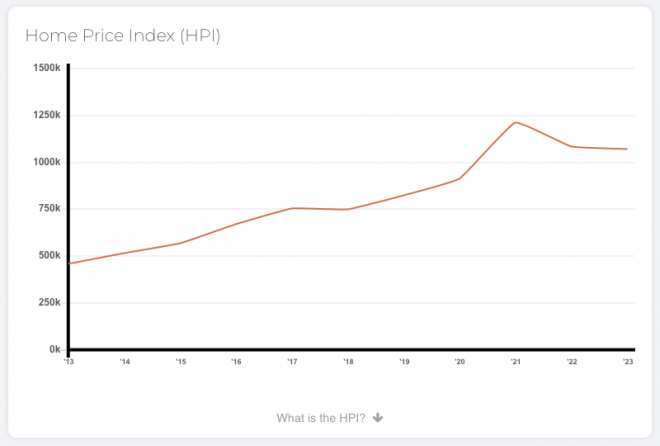
HPI provides a price growth measure for a benchmark home with the same characteristics over time, allowing for an apples-to-apples comparison from one year to the next.

HPI provides a price growth measure for a benchmark home with the same characteristics over time, allowing for an apples-to-apples comparison from one year to the next.

COMMERCIAL STATS

The “All Leasing Activity (Sq. Ft.)” chart summarizes total industrial, commercial/retail and office square feet leased through Toronto MLS® regardless of pricing terms.

The “All Sales Activity” chart summarizes total industrial and commercial/retail and office sales through Toronto MLS® regardless of pricing terms.

RESIDENTIAL CONDOMINIUM SALES STATS

RESIDENTIAL CONDOMINIUM RENTAL STATS

In conjunction with the Toronto Regional Real Estate Board (TRREB) redistricting project, historical data may be subject to revision moving forward. This could temporarily impact per cent change comparisons to data from previous years.

Distinctive Real Estate Advisors Inc., Brokerage is pleased to present a recap of the latest market forecast release and December highlights from the Toronto Regional Real Estate Board (TRREB).

We’d welcome an opportunity to discuss the GTA REALTORS Release December and Year-End 2023 Stats. If you have any questions about our services, please contact our team.
Elevated Borrowing Costs Taking a Toll on Housing Affordability

High borrowing costs and uncertain economic conditions continued to weigh on Greater Toronto Area (GTA) home sales in November 2023.

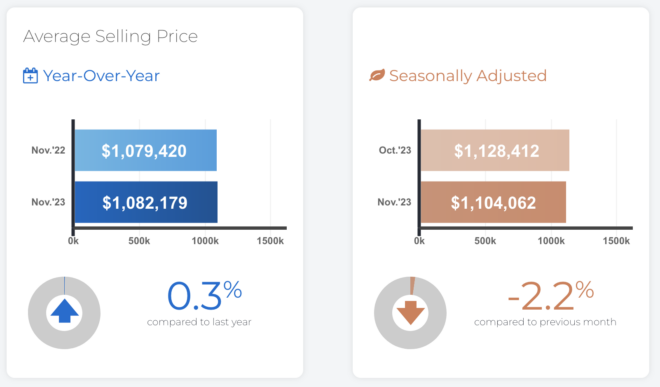
The Toronto Regional Real Estate Board (TRREB) stated earlier today that sales were down on a year-over-year basis, while listings were up from last year’s trough in supply. With more choice in the market, selling prices remained basically flat year-over-year. This has been no more apparent than in the interest rate-sensitive housing market. However, it does appear relief is on the horizon. Bond yields, which underpin fixed rate mortgages have been trending lower and an increasing number of forecasters are anticipating Bank of Canada rate cuts in the first half of 2024. Lower rates will help alleviate affordability issues for existing homeowners and those looking to enter the market.

RESIDENTIAL STATS

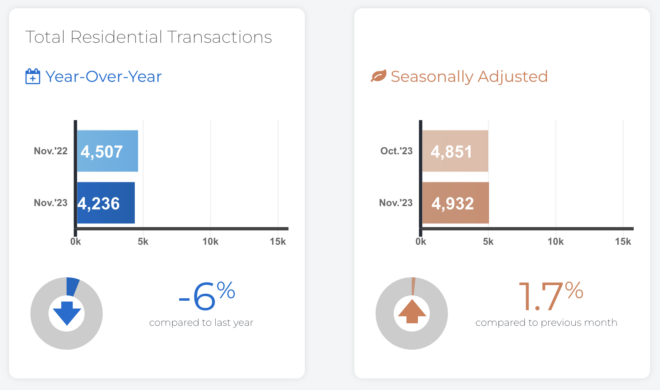
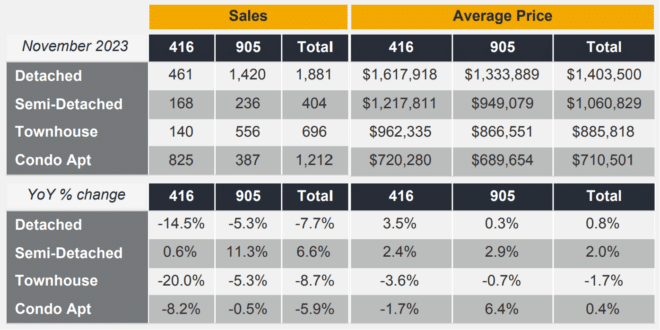
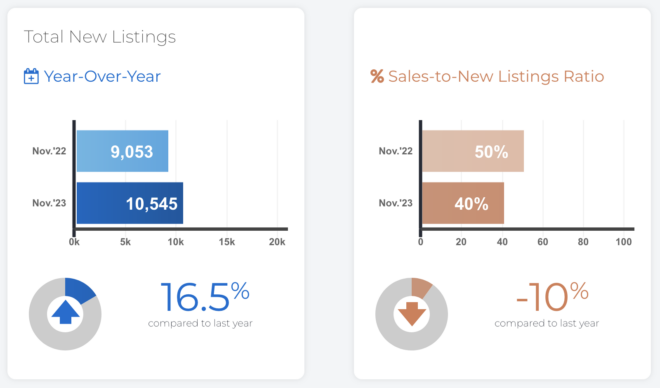
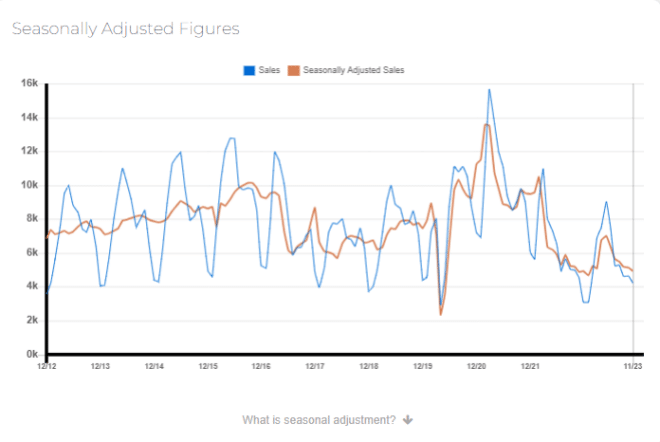
In November 2023, GTA REALTORS® reported 4,236 sales through TRREB’s MLS® System – a 6% decline compared to November 2022. Over the same period, the number of new listings was up by 16.5%. On a seasonally adjusted monthly basis, sales edged up compared to October 2023, while new listings were down by 5.5%.

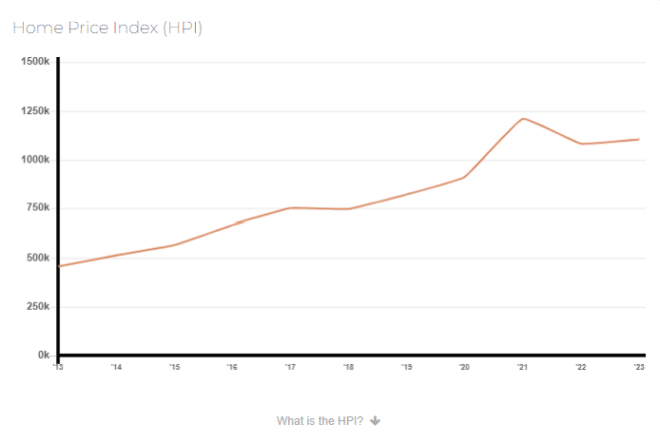
Home prices have adjusted from their peak in response to higher borrowing costs. This has provided some relief for buyers, from an affordability perspective.

As mortgage rates trend lower next year and the population continues to grow at a record pace, expect demand to increase relative to supply. This will eventually lead to renewed growth in home prices.

What is seasonal adjustment? Seasonality refers to a monthly (or quarterly) pattern that occurs in roughly the same manner from one year to the next, e.g., sales are highest in the spring and lowest in the winter each year.

HPI provides a price growth measure for a benchmark home with the same characteristics over time, allowing for an apples-to-apples comparison from one year to the next.


COMMERCIAL STATS

The “All Leasing Activity (Sq. Ft.)” chart summarizes total industrial, commercial/retail and office square feet leased through Toronto MLS® regardless of pricing terms.

The “All Sales Activity” chart summarizes total industrial and commercial/retail and office sales through Toronto MLS® regardless of pricing terms.

RESIDENTIAL CONDOMINIUM SALES STATS

The condominium apartment market is an important entry point into home ownership for first-time buyers. A better-supplied market has led to more choice for these buyers, resulting in more negotiation power and lower selling prices on average. A pause in price growth has helped mitigate the impact of higher monthly mortgage payments.

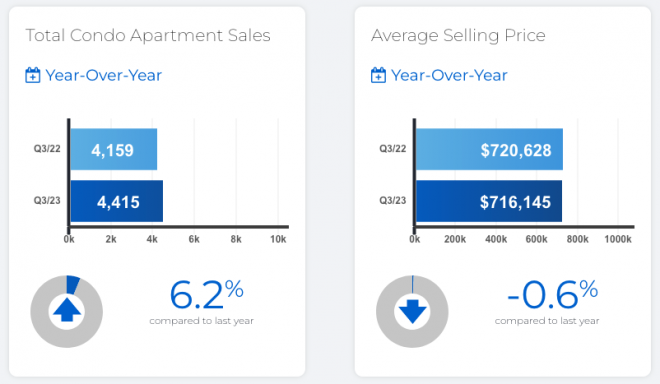
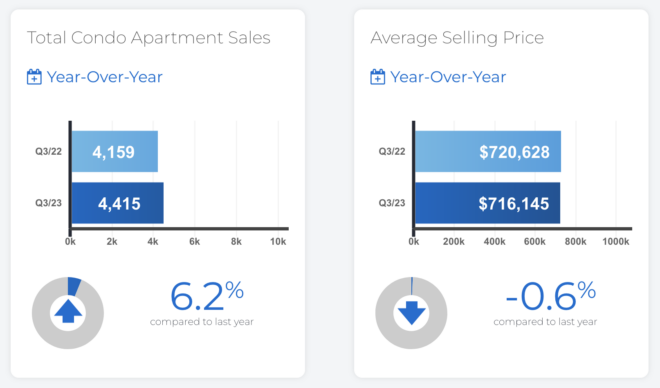
in the third quarter of 2023, the average selling price for a condominium apartment GTA-wide was $716,145 – down slightly compared to $720,628 in Q3-2022. In the City of Toronto, which accounted for approximately two-thirds of condo apartment sales, the average selling price was $736,566 – down from $750,087 in Q3-2022. While condo market conditions have become more balanced over the past year-and a-half, we will likely start to see a tightening in the market in the second half of 2024.

The GTA population is growing at a record pace and the consensus view is that we will start to see some relief in terms of borrowing costs beginning in 2024 and even more so in 2025.

RESIDENTIAL CONDOMINIUM RENTAL STATS

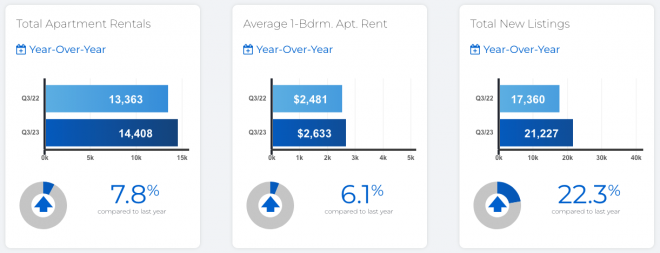
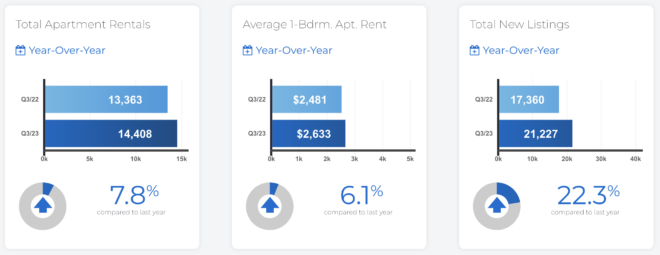
Strong population growth and high borrowing costs continued to drive demand for GTA rental housing in the third quarter. Would-be first-time buyers, who have seen affordability erode over the past year-and-a-half due to high mortgage rates, have remained in the rental market. Many new permanent and temporary residents have also turned to the rental market for housing. Renters can expect this trend to continue for the foreseeable future, underpinning the need for a sustainable pipeline of rental housing supply.

The supply of units for rent has increased at a faster pace than rental transactions over the past year. Many investor-owned units have been listed for rent, in response to very strong rent growth and, quite possibly, the actual or potential introduction of tighter regulations surrounding vacant units and short-term rentals. However, despite a better-supplied market, competition between renters has remained strong enough to sustain above-inflation rent increases.

In conjunction with the Toronto Regional Real Estate Board (TRREB) redistricting project, historical data may be subject to revision moving forward. This could temporarily impact per cent change comparisons to data from previous years.

Distinctive Real Estate Advisors Inc., Brokerage is pleased to present a recap of the latest market forecast release and November highlights from the Toronto Regional Real Estate Board (TRREB).

We’d welcome an opportunity to discuss the Elevated Borrowing Costs Taking a Toll on Housing Affordability. If you have any questions about our services, please contact our team.