- Lack of affordability and uncertainty remained issues for many would-be home buyers in the Greater Toronto Area (GTA) in October 2023. As a result, sales edged lower compared to last year.
- Selling prices remained higher than last year’s levels. Record population growth and a relatively resilient GTA economy have kept the overall demand for housing strong.
- More of that demand has been pointed at the rental market, as high borrowing costs and uncertainty on the direction of interest rates has seen many would-be home buyers remain on the sidelines in the short term. When mortgage rates start trending lower, home sales are predicted to pick up quickly.
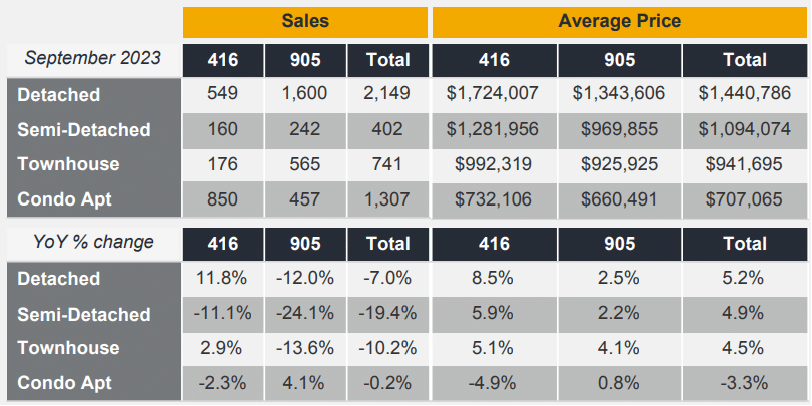
RESIDENTIAL STATS
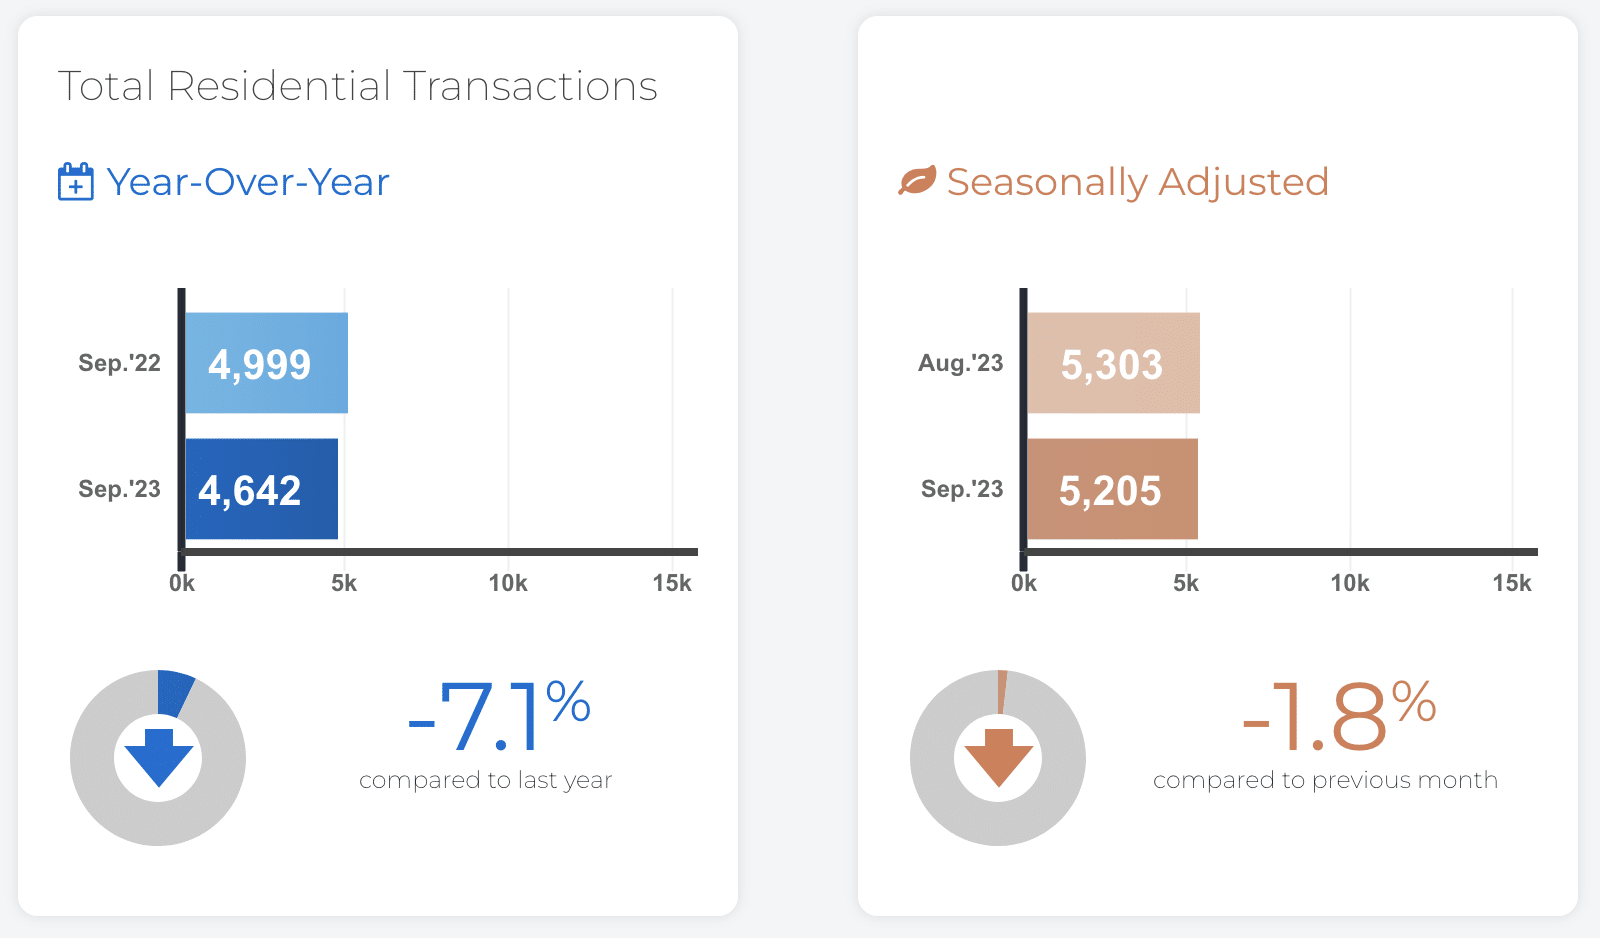
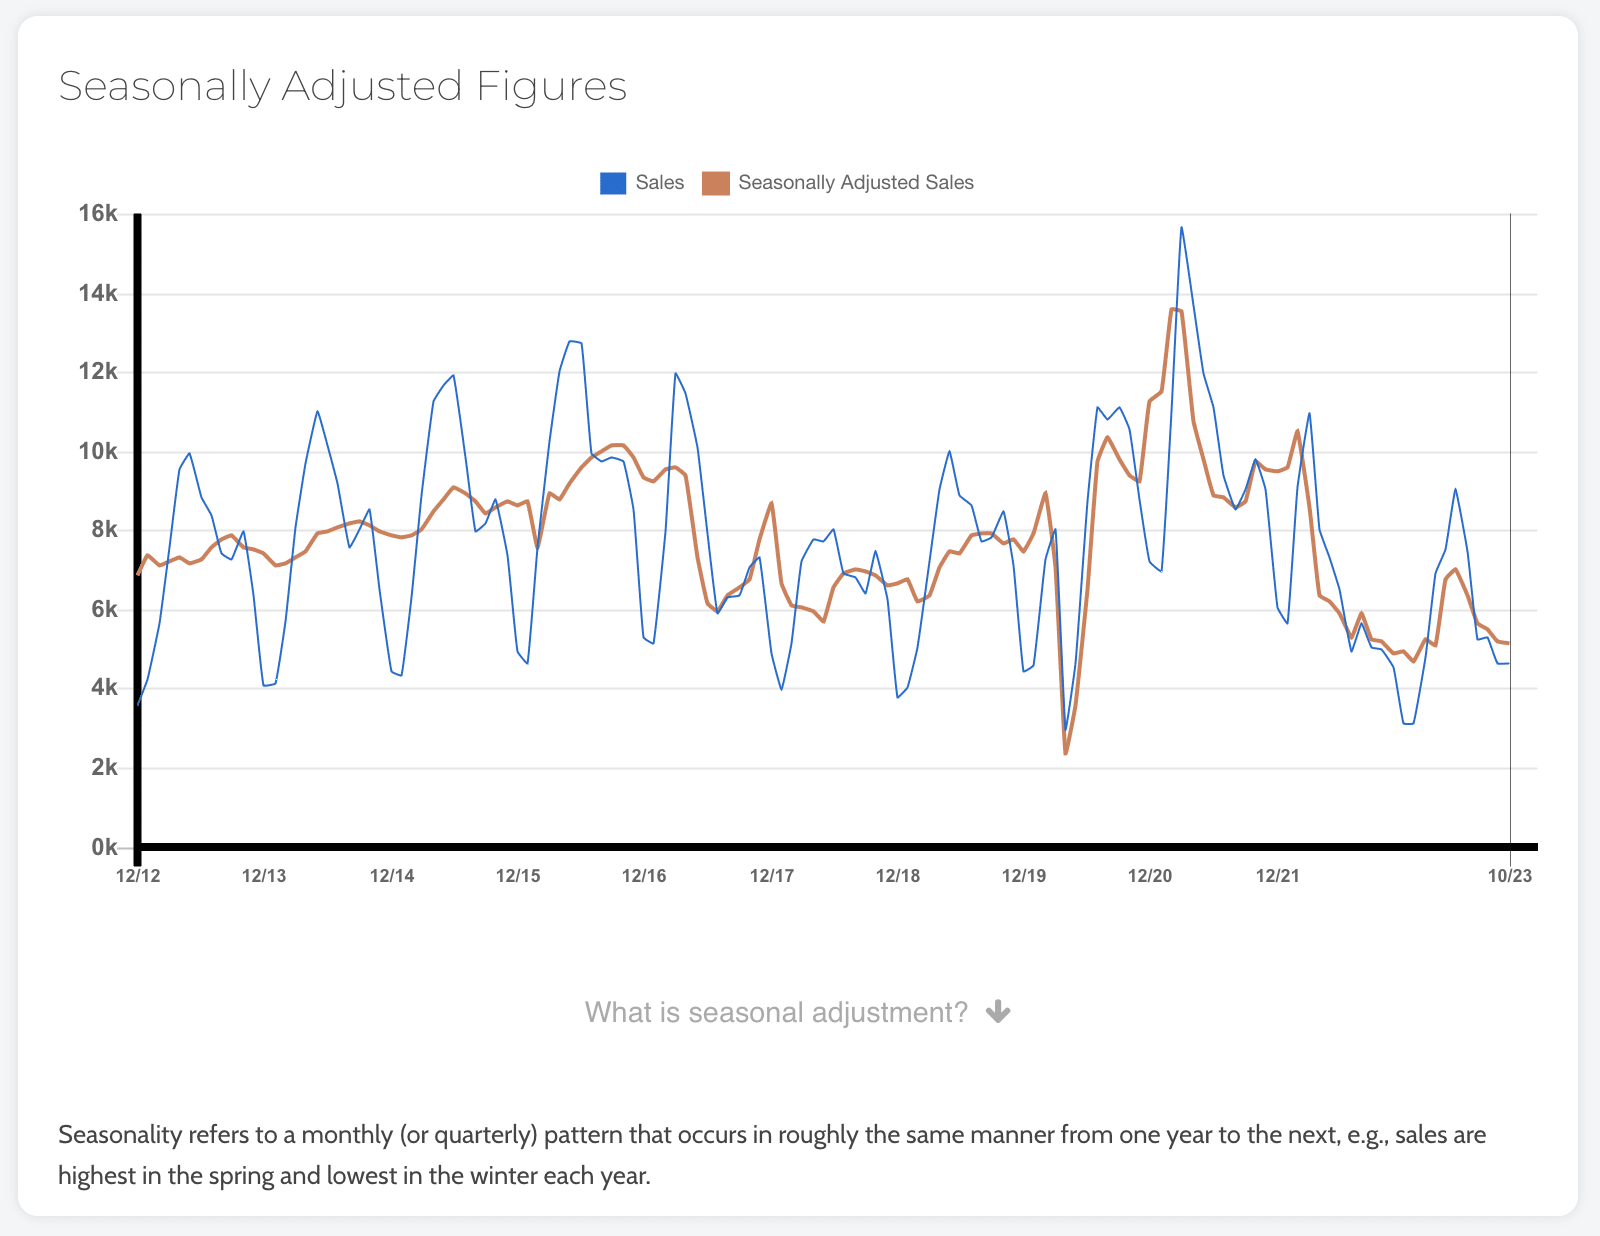
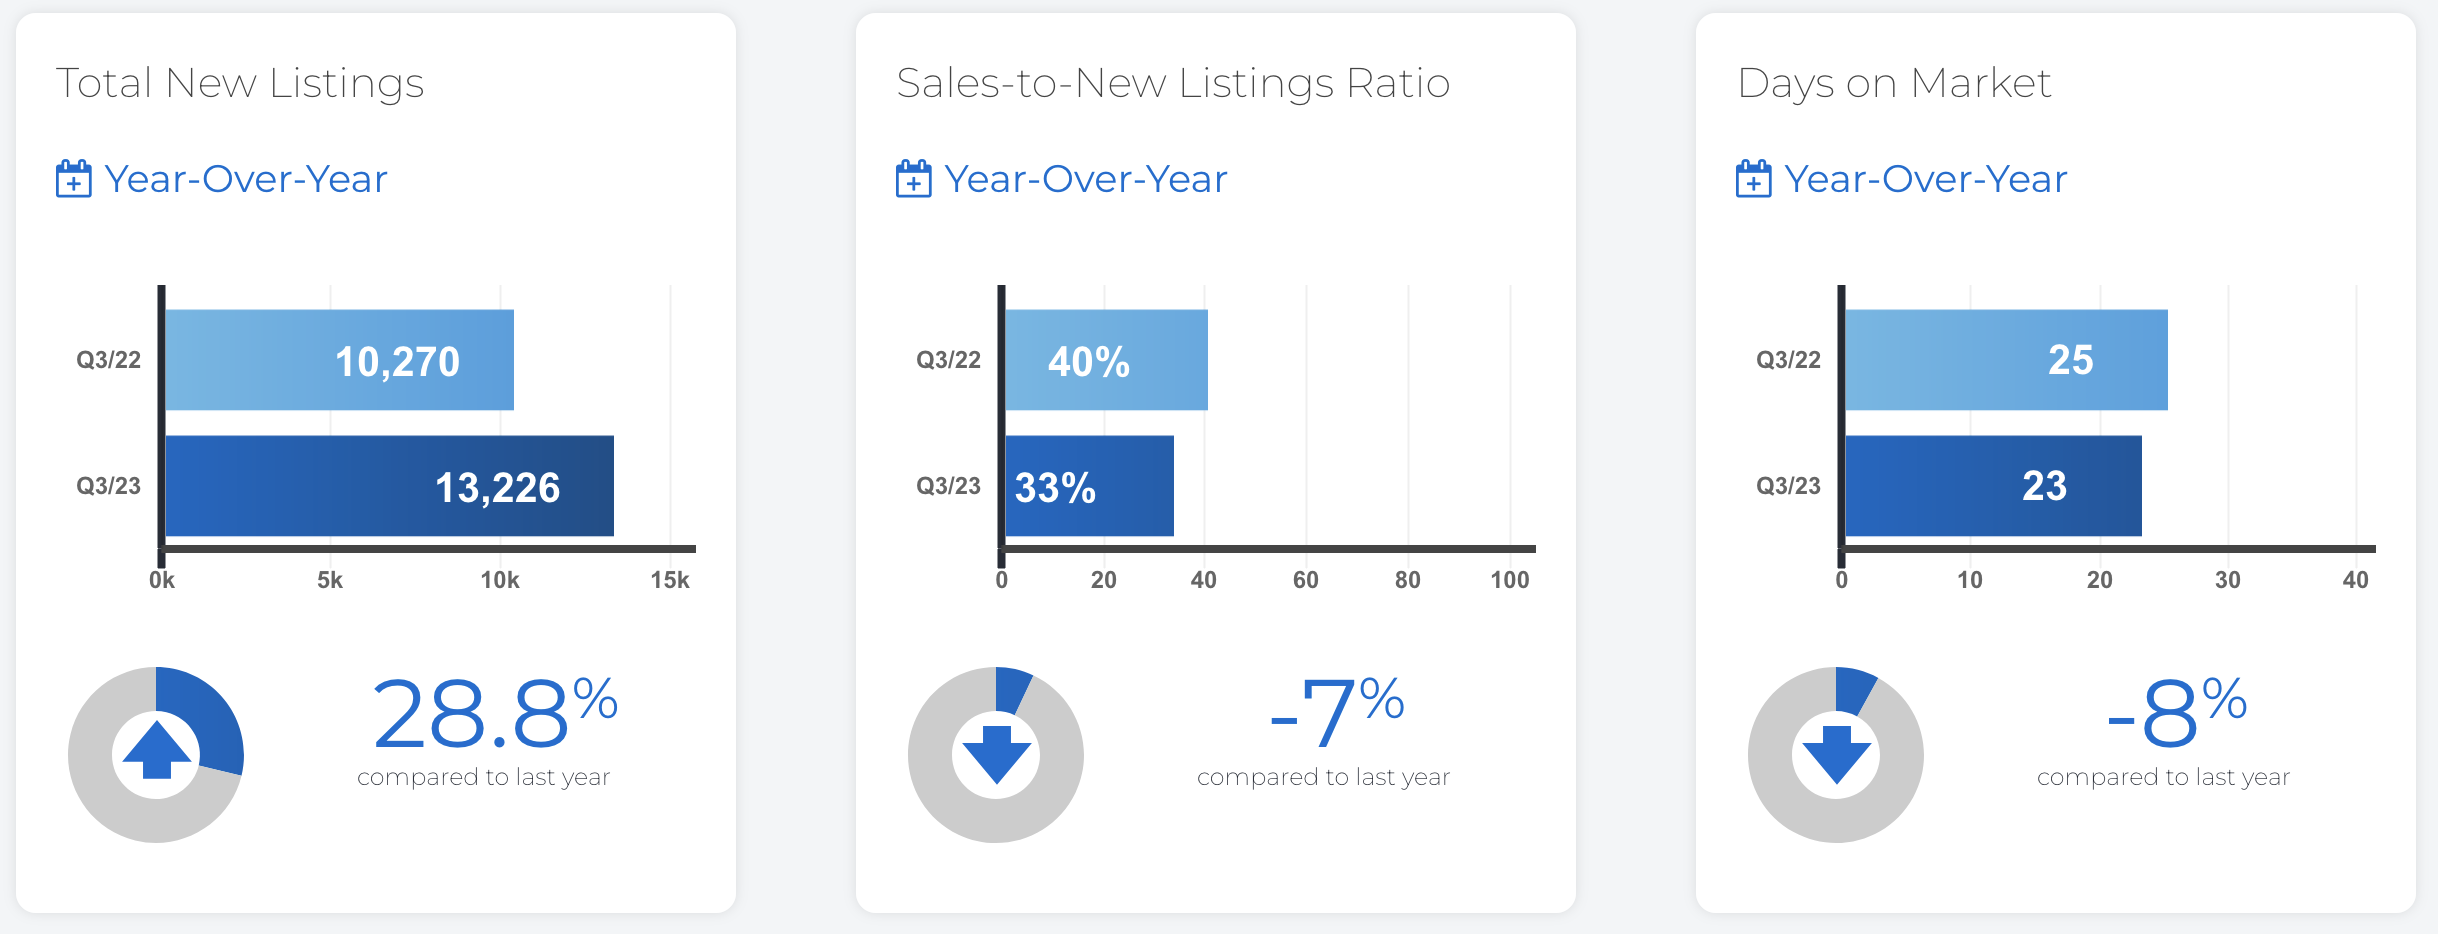
REALTORS® reported 4,646 GTA home sales through TRREB’s MLS® System in October 2023 – down 5.8 per cent compared to October 2022. On a month-over-month seasonally-adjusted basis, sales were also down in comparison to September.
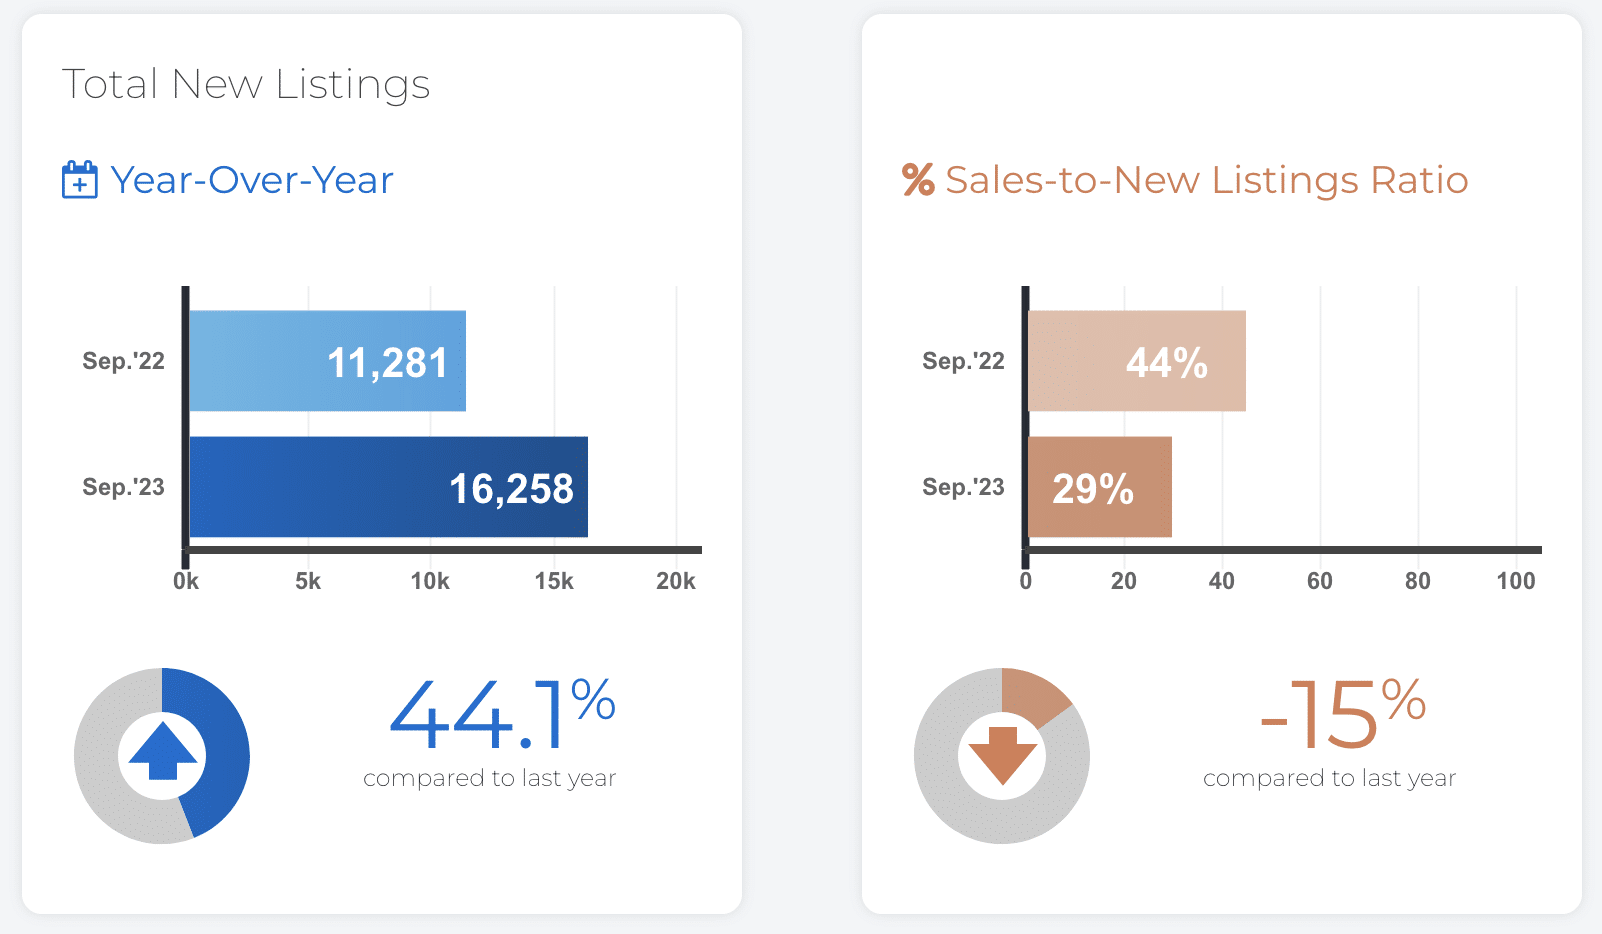
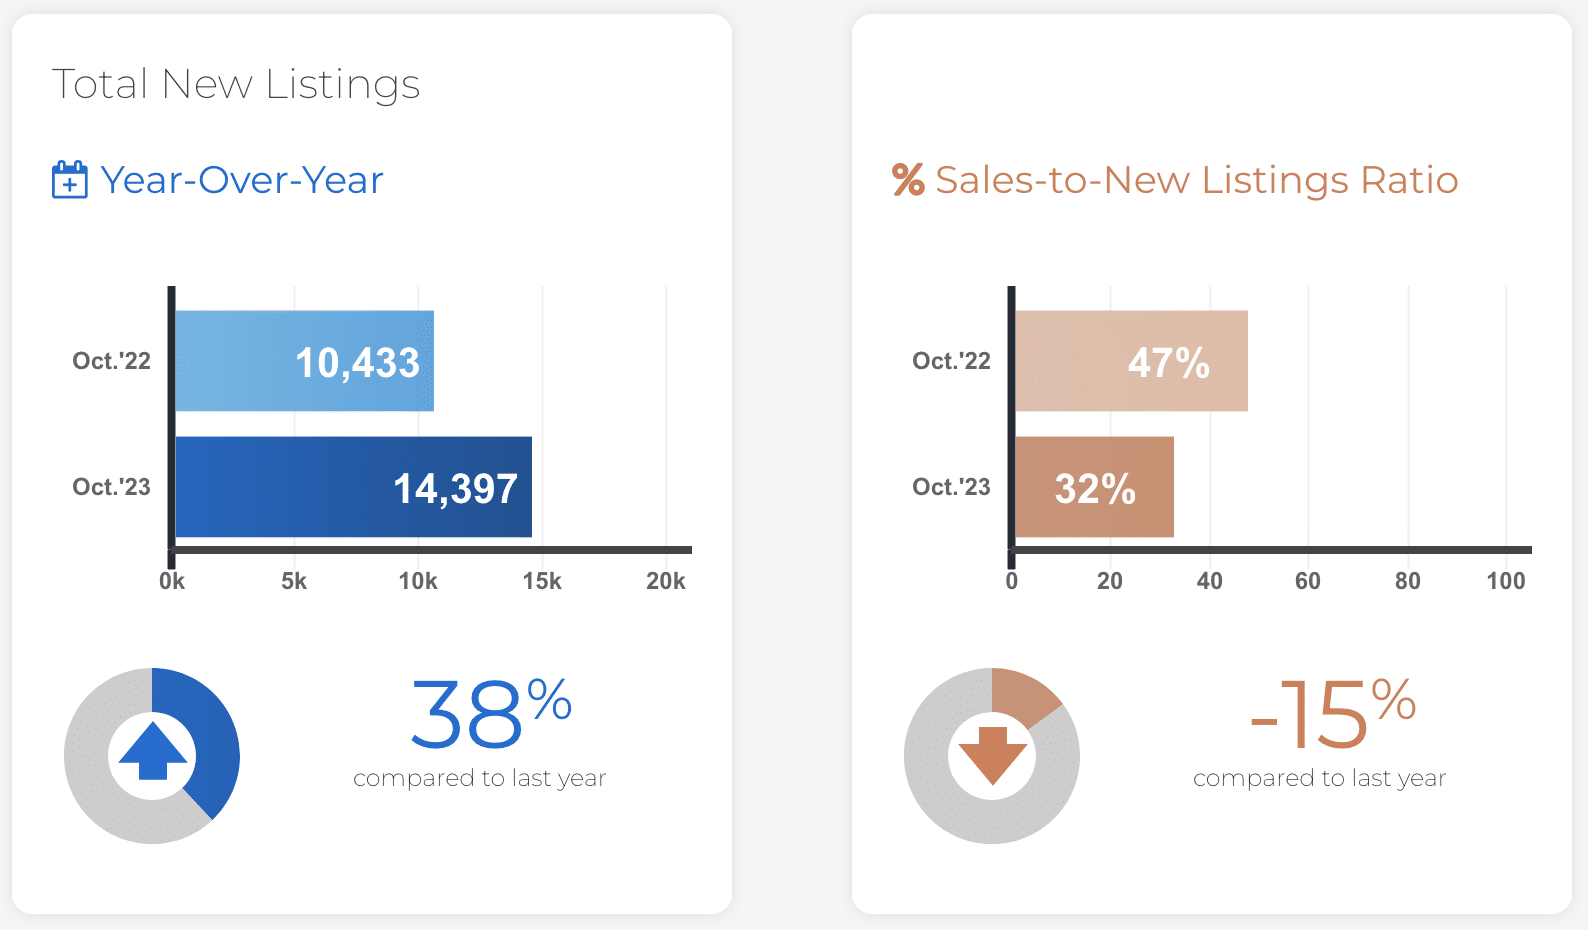
New listings in October 2023 were up noticeably compared to the 12-year low reported in October 2022, but up more modestly compared to the 10-year average for October. New listings, on a seasonally adjusted basis, edged slightly lower month-over-month compared to September 2023.
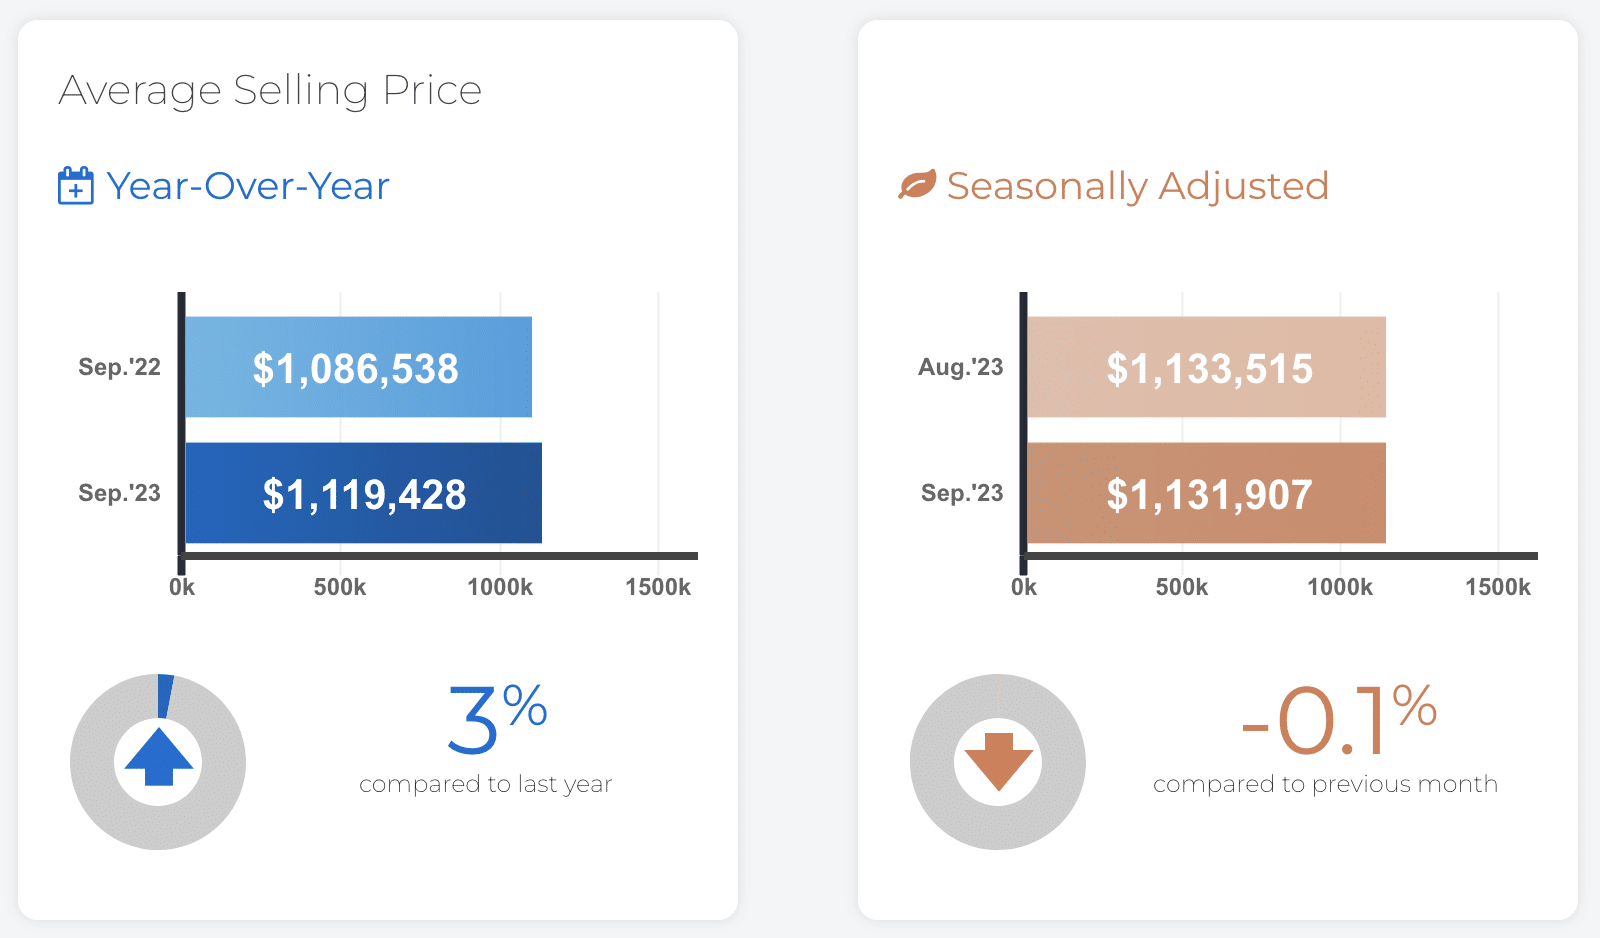
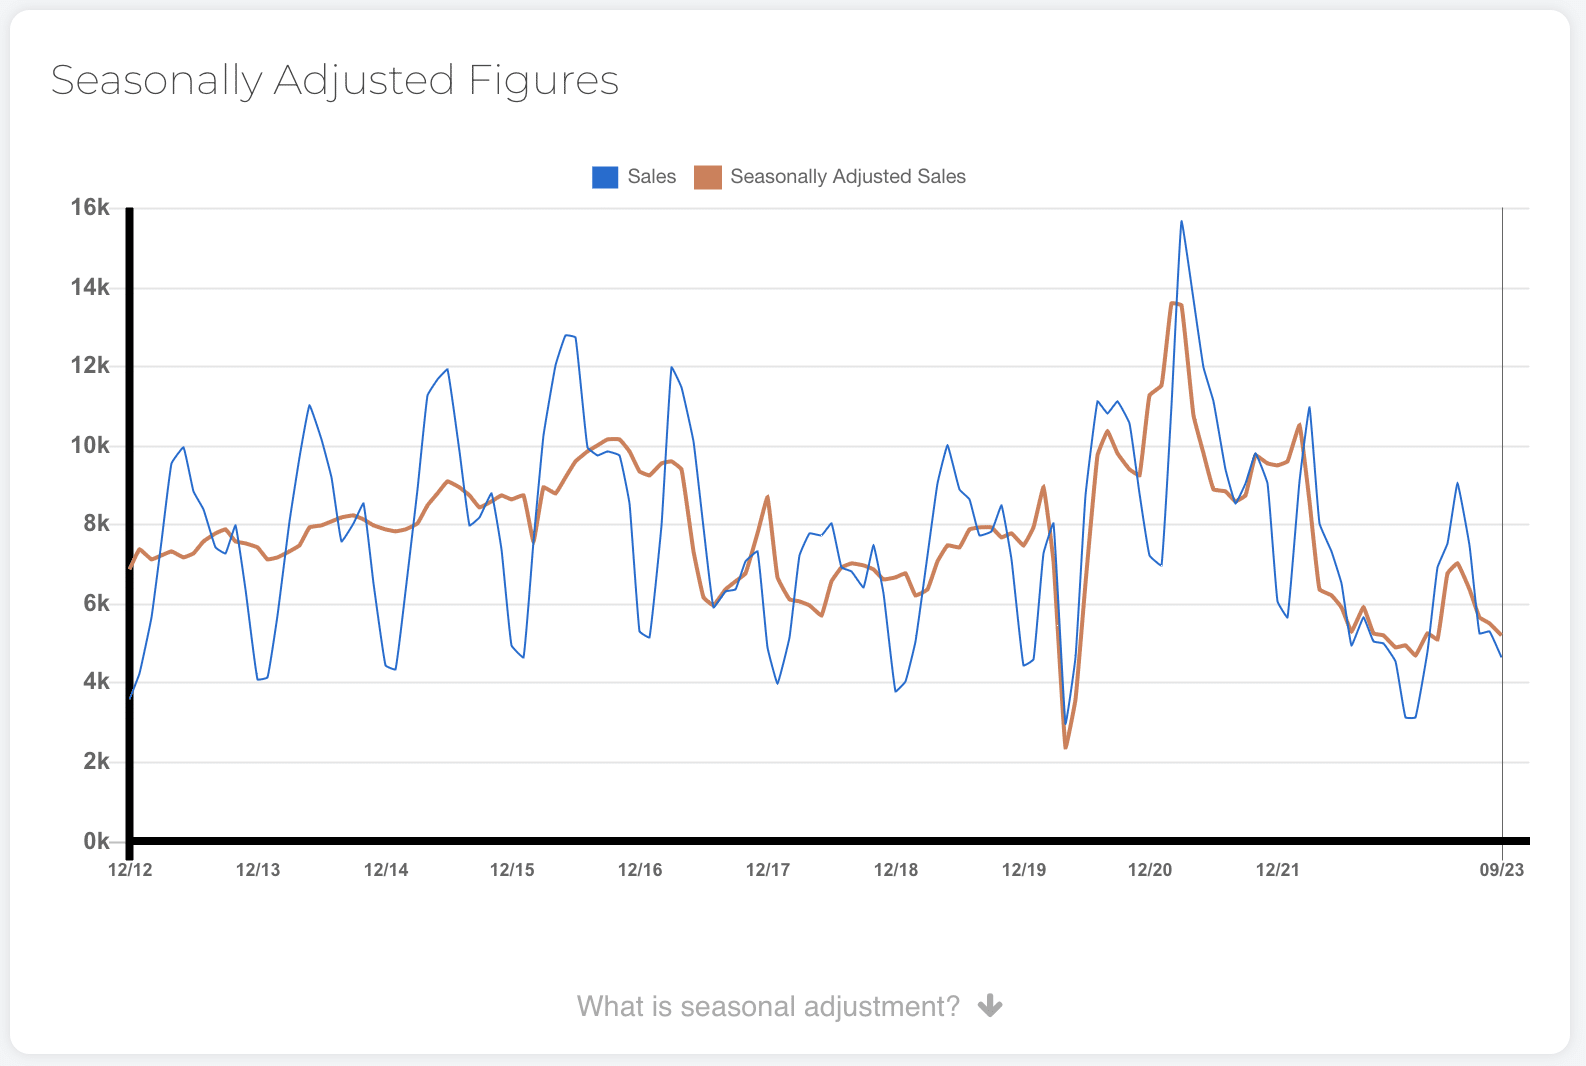
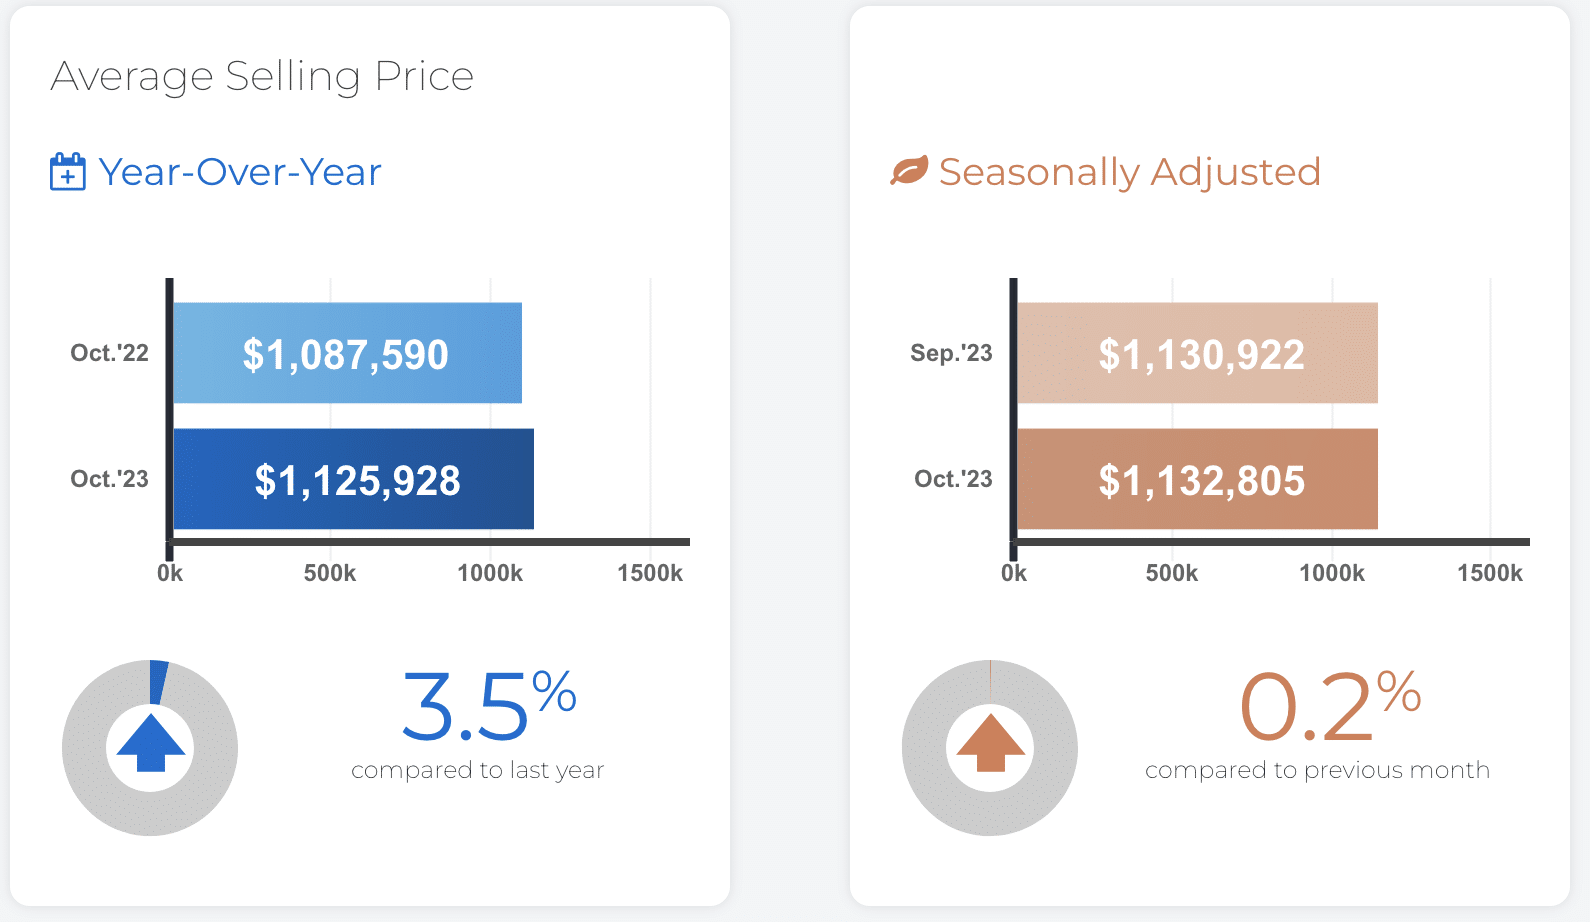
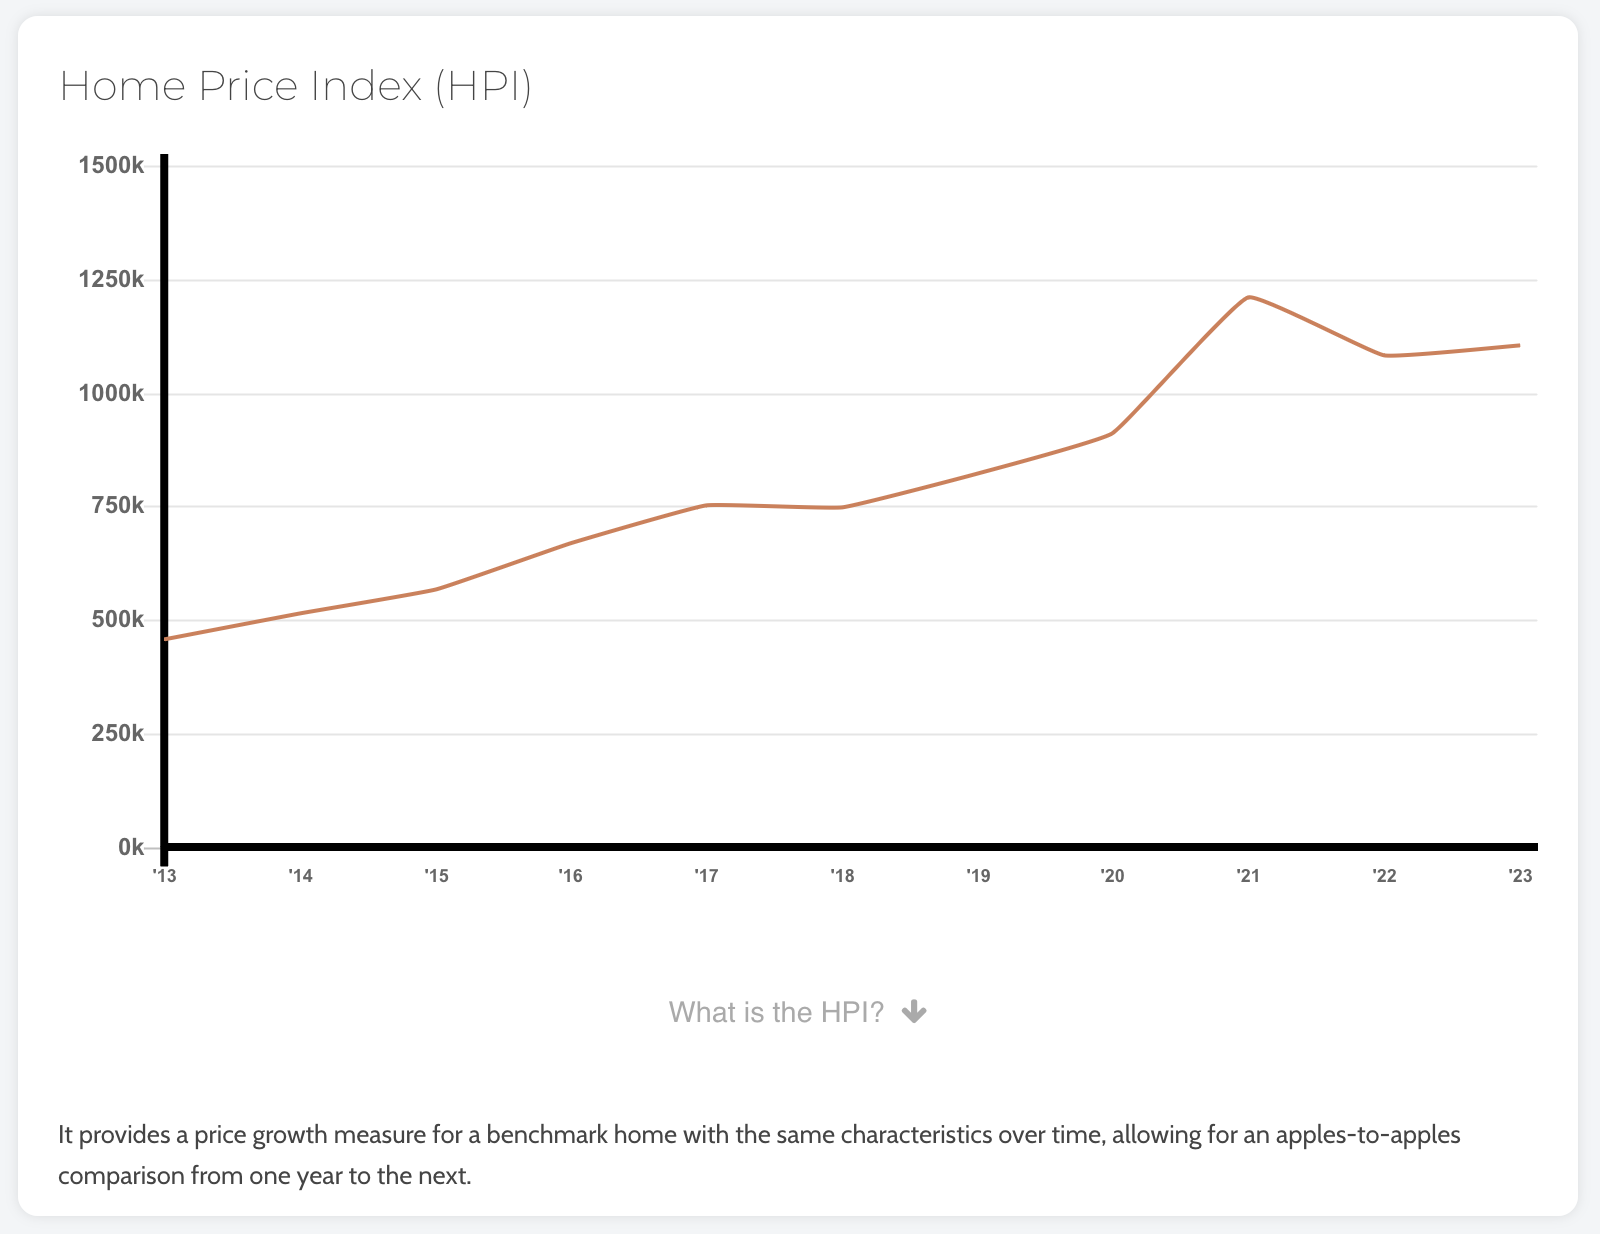
The October 2023 MLS® Home Price Index Composite benchmark and the average selling price were both up on year-over-year basis, by 1.4 per cent and 3.5 per cent respectively. On a seasonally adjusted basis, the MLS® HPI Composite benchmark edged lower compared to September 2023 while the average selling price remained at a similar level. Both the MLS® HPI Composite benchmark and average price remained above the cyclical lows experienced at the beginning of 2023.

Competition between buyers remained strong enough to keep the average selling price above last year’s level in October and above the cyclical lows experienced in the first quarter of this year. The Bank of Canada also noted this resilience in its October statement. However, home prices remain well-below their record peak reached at the beginning of 2022, so lower home prices have mitigated the impact of higher borrowing costs to a certain degree.
In the current environment of extremely high borrowing costs, it is disappointing to see that there has been no relief for uninsured mortgage holders reaching the end of their current term. If these borrowers want to shop around for a more competitive rate, they are still forced to unrealistically qualify at rates approaching eight per cent. Following their most recent round of consultations, the Office of the Superintendent of Financial Institutions should have eliminated this qualification rule for those renewing their mortgages with a different institution.

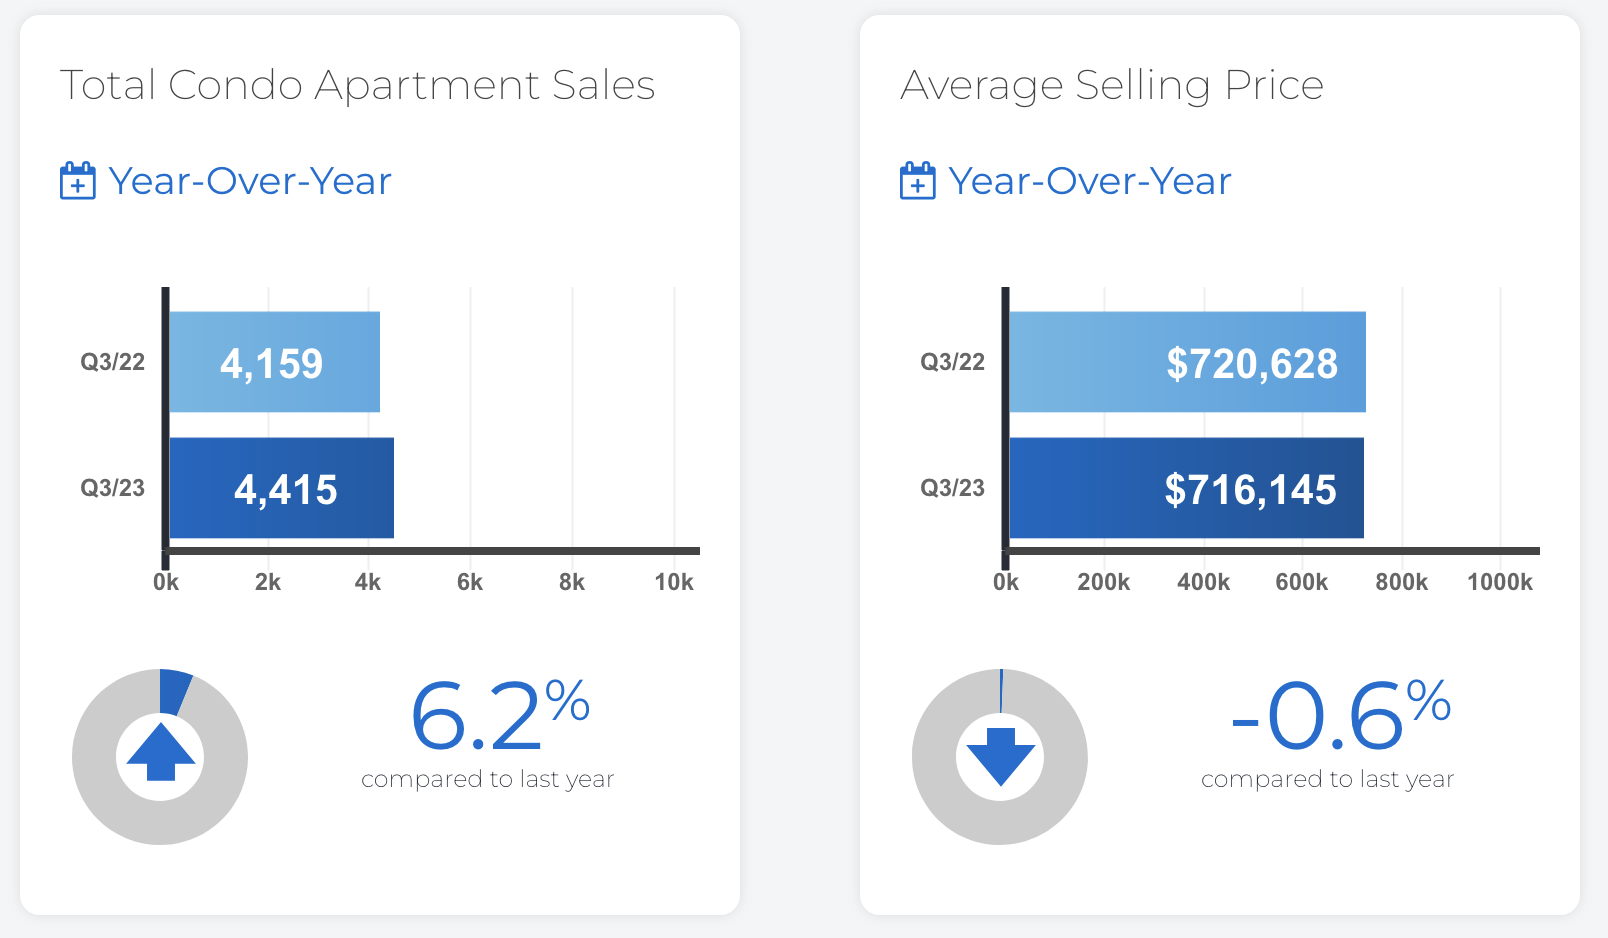
CONDO SALE STATS
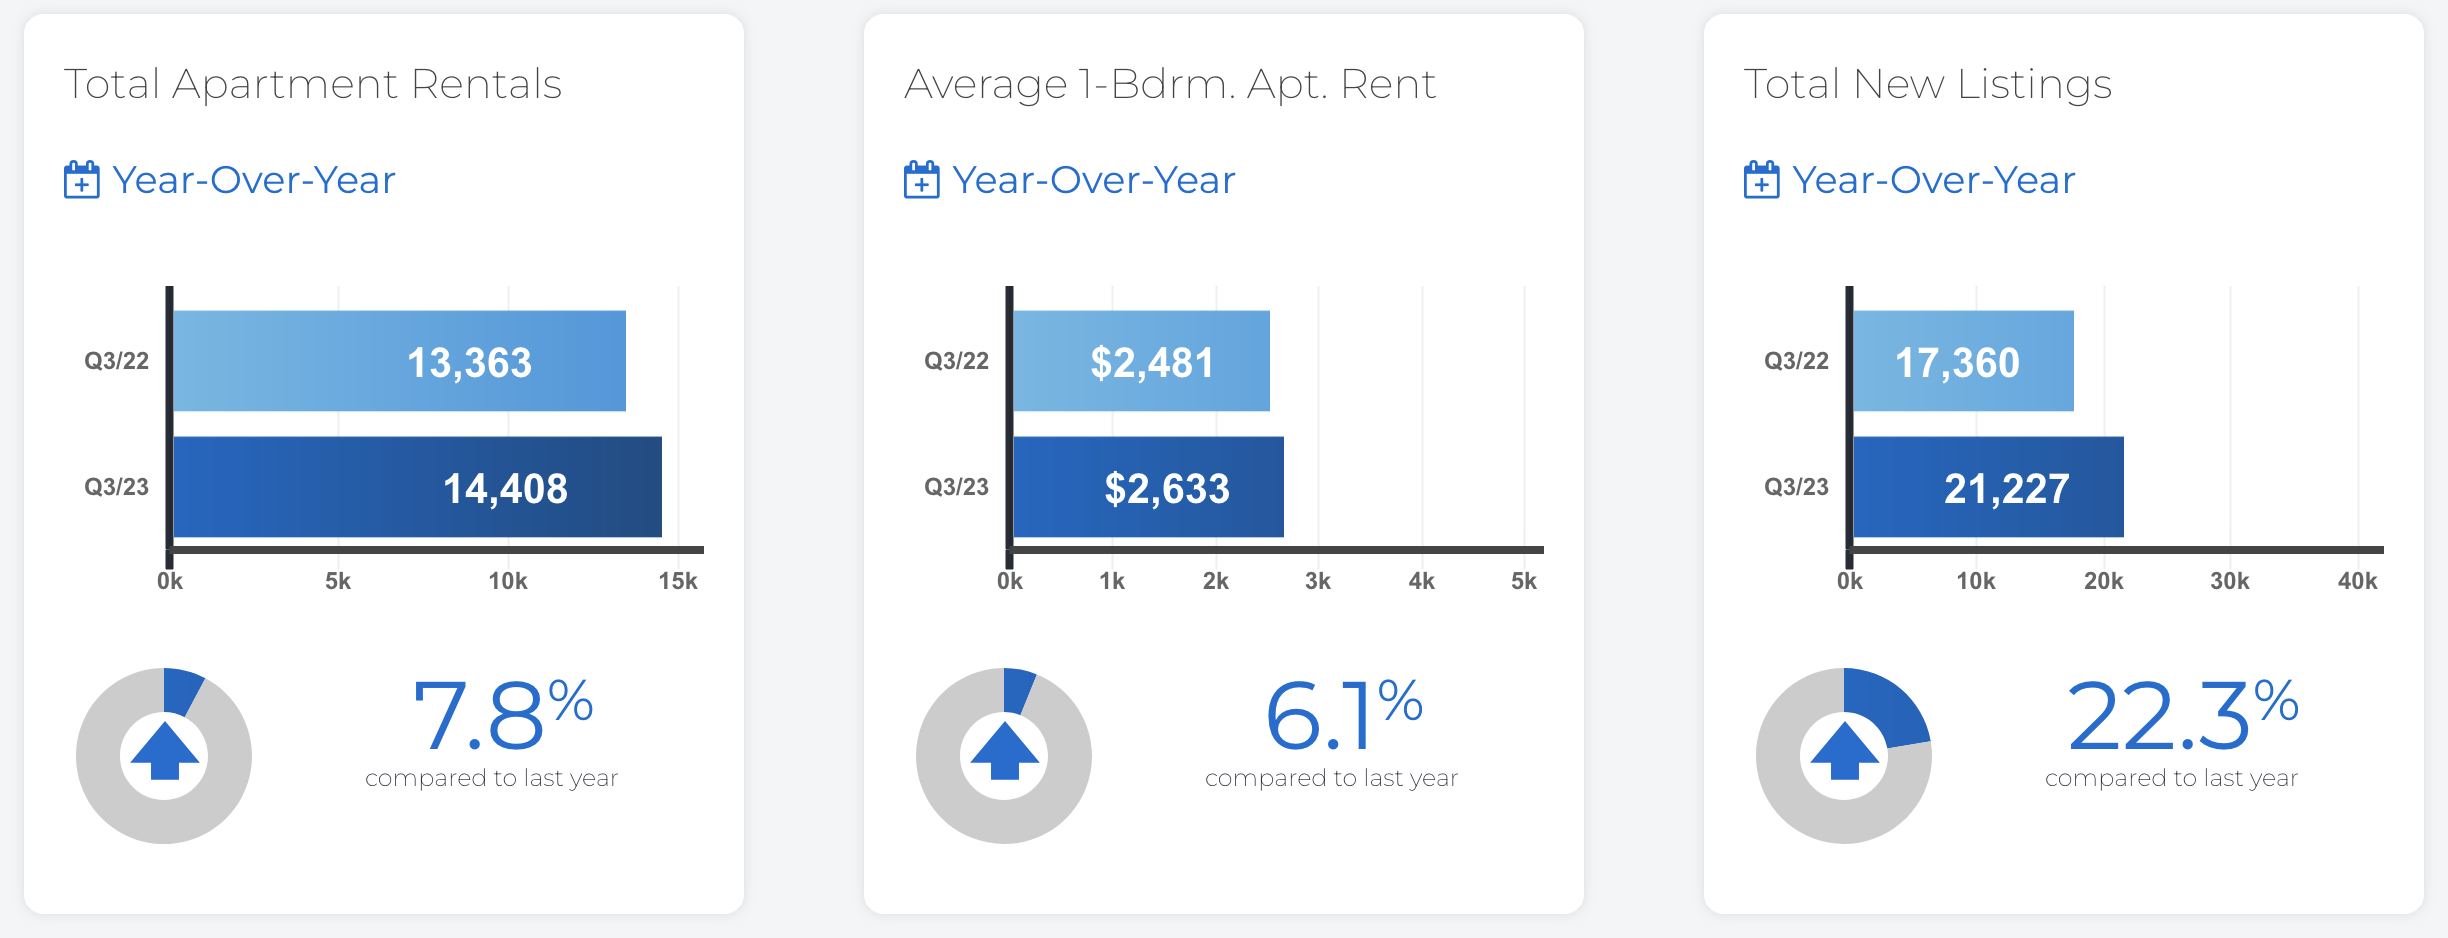
CONDO RENTAL STATS
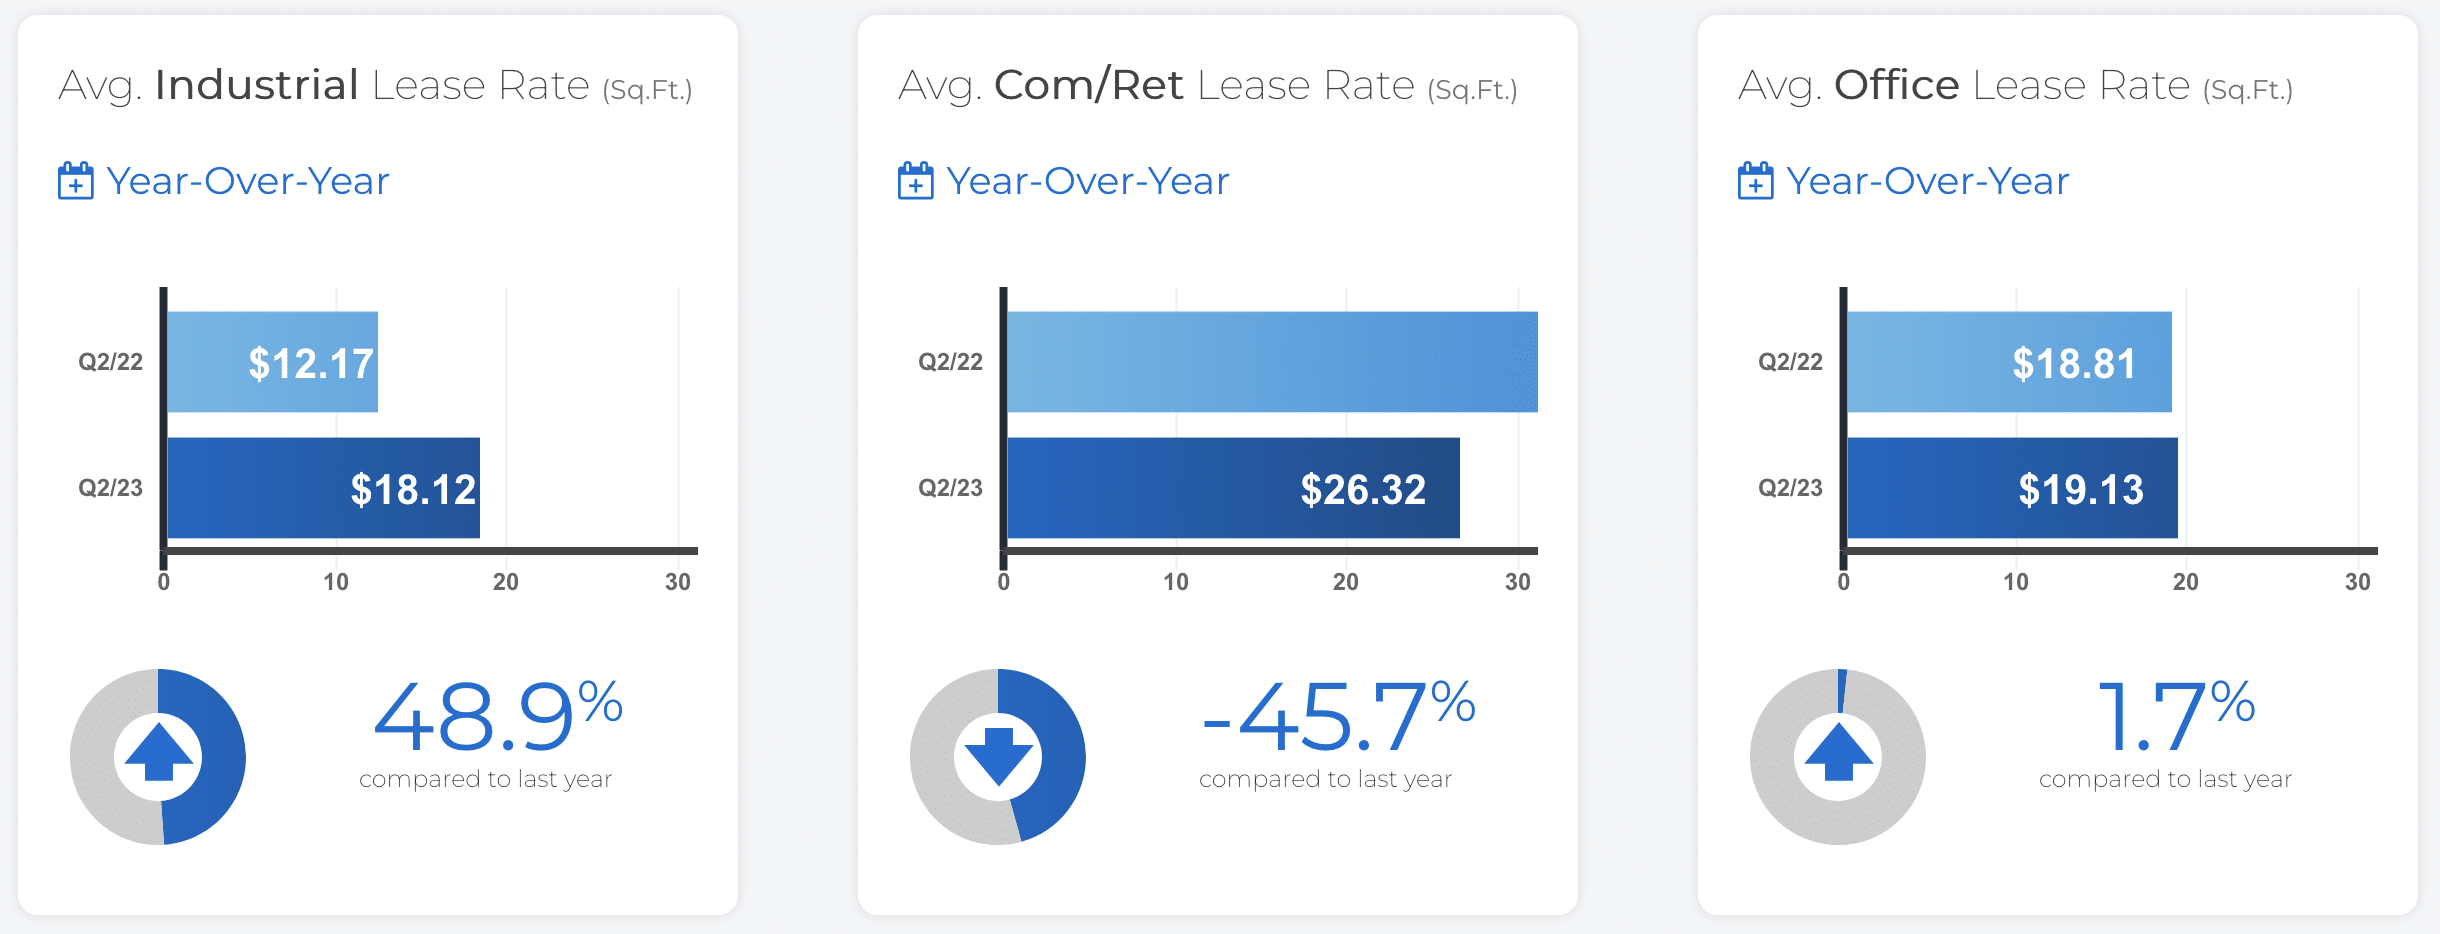
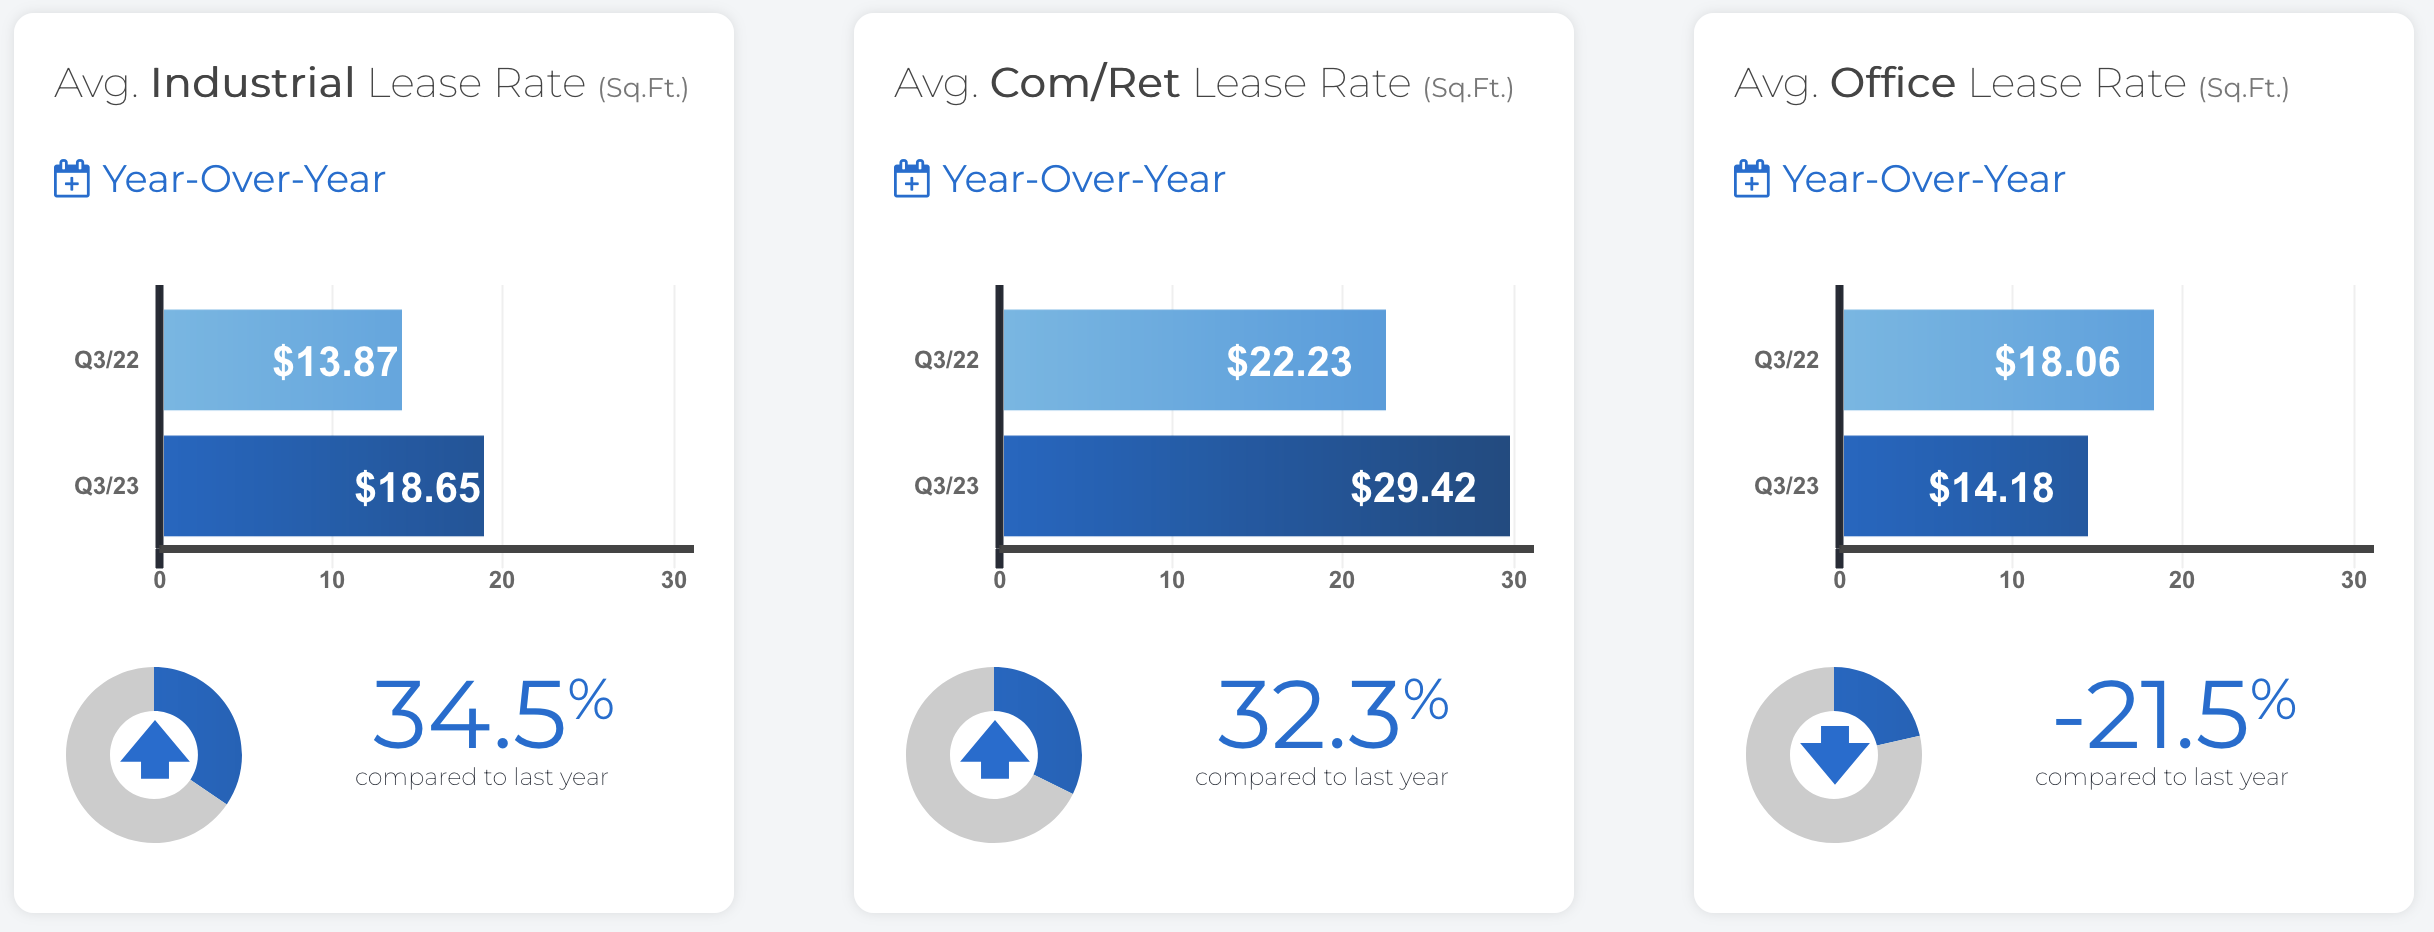
COMMERCIAL STATS
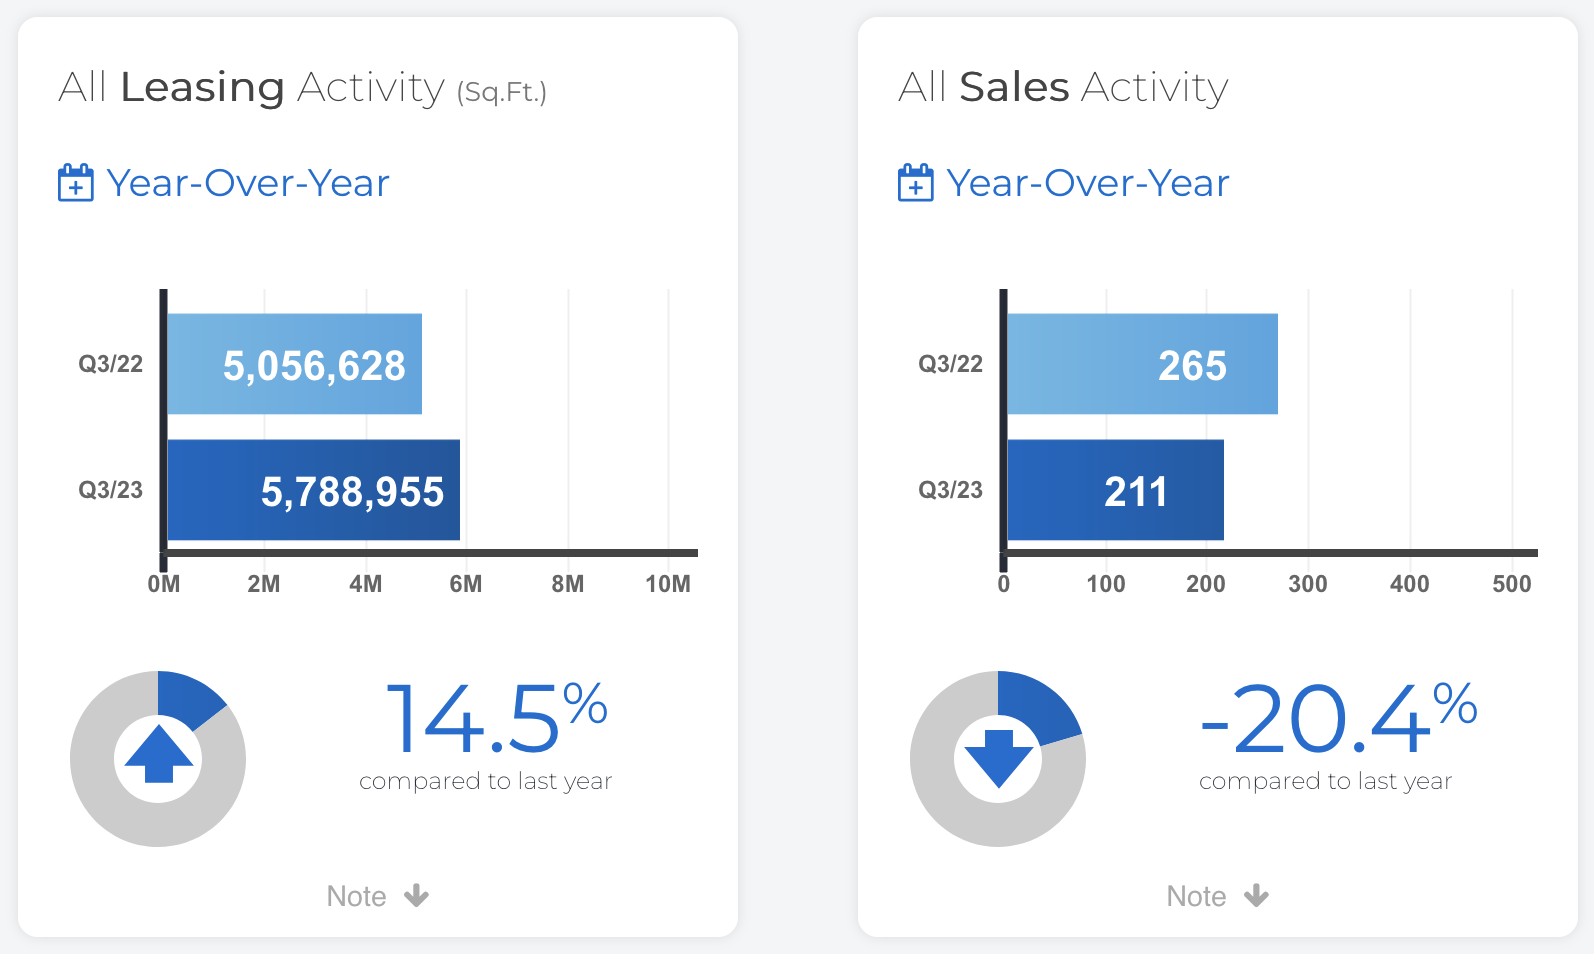
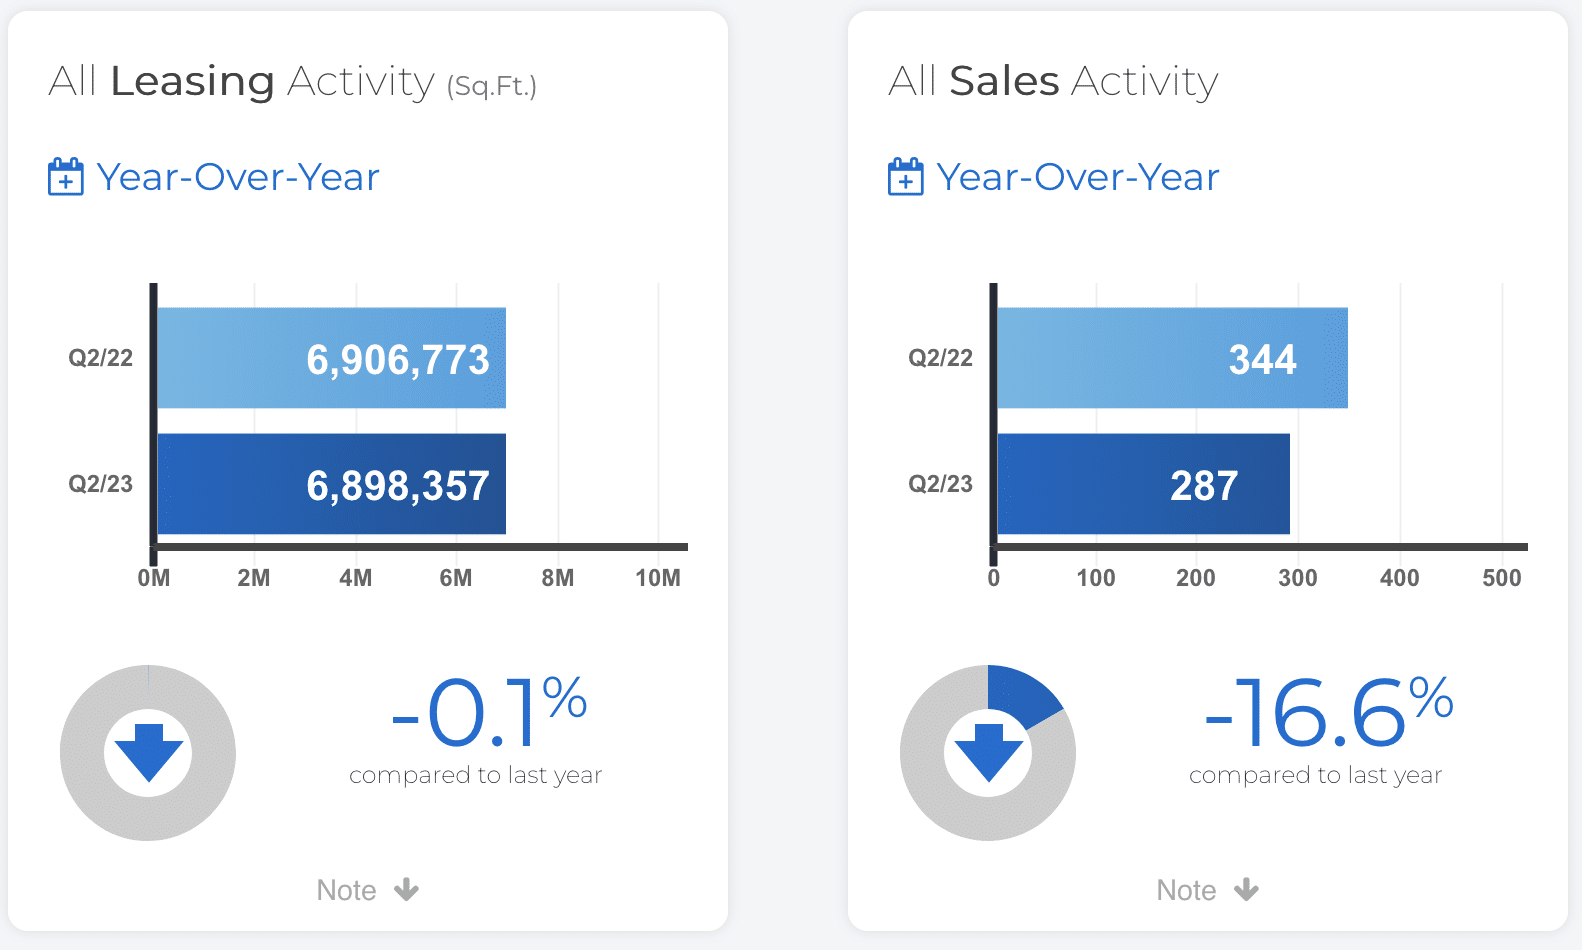
The “All Leasing Activity (Sq. Ft.)” chart summarizes total industrial, commercial/retail and office square feet leased through Toronto MLS® regardless of pricing terms.
The “All Sales Activity” chart summarizes total industrial and commercial/retail and office sales through Toronto MLS® regardless of pricing terms.
In conjunction with the Toronto Regional Real Estate Board (TRREB) redistricting project, historical data may be subject to revision moving forward. This could temporarily impact per cent change comparisons to data from previous years.
Distinctive Real Estate Advisors Inc., Brokerage is pleased to present a recap of the latest market forecast release and October highlights from the Toronto Regional Real Estate Board (TRREB).
We’d welcome an opportunity to discuss the GTA Realtors Release October 2023 Stats. If you have any questions about our services, please contact our team.