real estate –

Distinctive Advisors Inc.

Menu

Distinctive Real Estate Advisors Inc., Brokerage | Distinctive Real Estate Advisors Inc., Mortgage Broker License #12592

Tag Archives: real estate

Tiff Macklem, BoC | Fighting to get back to low inflation

HIGH INFLATION MAKES LIFE HARDER FOR EVERYONE

Distinctive Advisors is pleased to provide you with the highlights from the Wednesday, November 22nd speech by Governor Tiff Macklem, Bank of Canada (“BoC“), outlining how high inflation is hurting Canadians and how monetary policy is working to bring it down. He also explains why the Bank of Canada must stay the course in its inflation fight.

The economy and job market have done quite well since the worst of the COVID-19 pandemic.

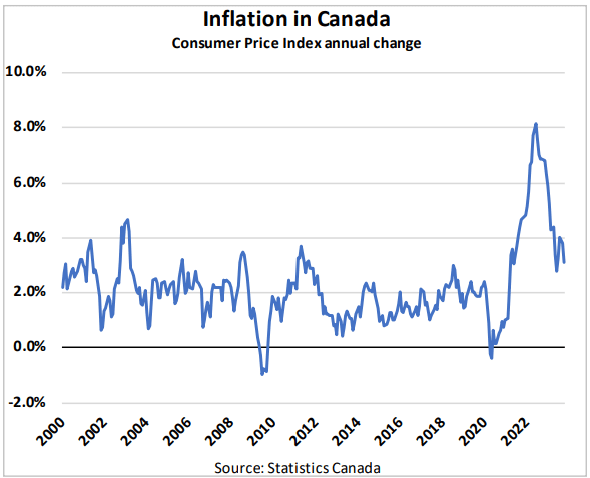
But Canadians aren’t happy—and high inflation is a major reason why.

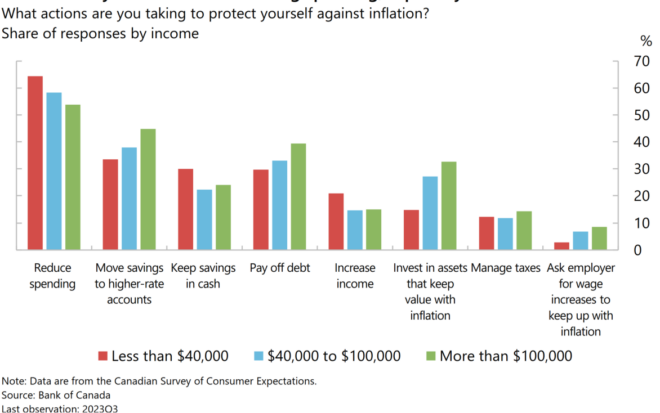
Almost 9 out of 10 people responding to BoC‘s Canadian Survey of Consumer Expectations (“CSCE“) said high inflation has made them feel worse off. BoC can see the impacts of high inflation in other ways too:

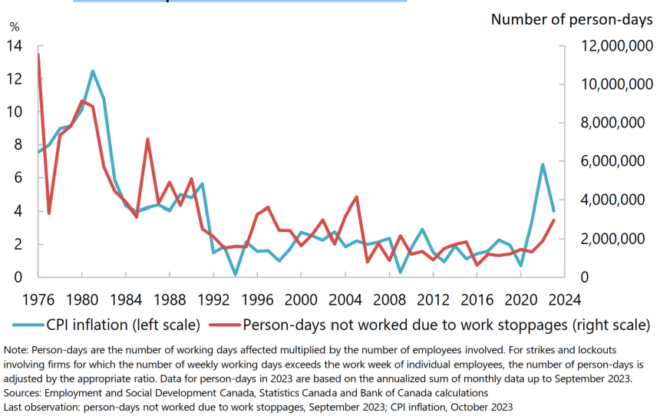
  • Labour strikes have increased, with employers and workers struggling to agree on fair pay.
  • Businesses have been raising their prices more often than usual, and by larger amounts.
  • The CSCE survey show families are spending less and trying to find cheaper goods and services.

High inflation is particularly hard for lower-income Canadians. They have little savings to buffer higher prices, and necessities—food, rent, gasoline—have had some of the fastest price increases.

LOW UNEMPLOYMENT IS NOT BOOSTING CONSUMER CONFIDENCE

INFLATION WAS ESPECIALLY HIGH AND HARMFUL IN THE 1970s

Back in the ‘70s, just as now, global economic forces caused prices to climb around the world. However, inflation rose higher then, and remained high for longer, peaking at almost 13% and averaging more than 7% for the decade.

With such high inflation throughout the ‘70s, that decade also had a lot of strikes— many of which were long and heated. People felt ripped off because they’d get raises but prices would keep on rising.

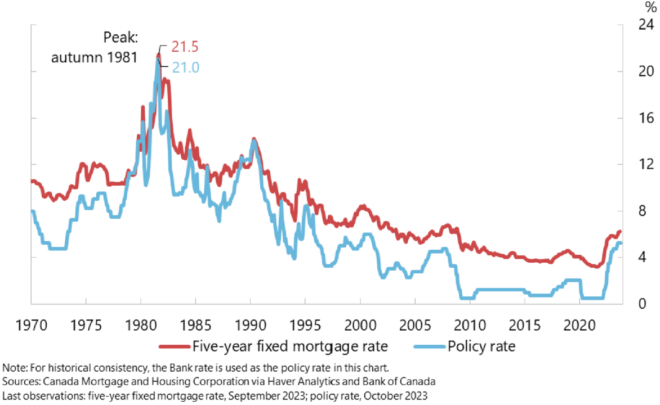
Policy-makers tried to get inflation down, but their measures were either ineffective or too timid. Eventually, it took very high interest rates and a deep recession with high unemployment to lower inflation.

IN 1981, THE POLICY RATE AND MORTGAGE RATES CLIMBED ABOVE 20%

ADVANTAGES WE HAVE THIS TIME AROUND — WHAT’S DIFFERENT TODAY?

Tiff Macklem expressed confidence that we will get back to low inflation more quickly and at lower economic cost than we did in the 1970s. In his opinion, we have learned the bitter lessons from that time. And we’ve got some distinct advantages this time around: an inflation target with a strong track record and a forceful and sustained response.

BoC began targeting inflation more than 30 years ago. Since 1995, their inflation target has been 2%, the middle of the band of 1% to 3%. Between then and when the pandemic hit in 2020, inflation averaged 1.9% and was within that band 80% of the time — BoC’s expressed view is a remarkable success compared with the 1970s and 1980s.

Click here for a transcript of the full remarks from November 22nd, 2023 by Tim Macklem, Governor of the Bank of Canada.


Is your mortgage renewal coming up? Call us to discuss your options and to:

  1. Evaluate your current market position and help you assess your future market position based on your plans and goals;
  2. Walk you though the impacts of your next mortgage renewal on your real estate portfolio; and to
  3. Help assess your options including holding real estate, disposing of it, acquiring it or leasing it.

Call us at 416-925-3140 or 613-366-8525, or e-mail us today.

Ottawa MLS® October Home Sales Show Typical Lull

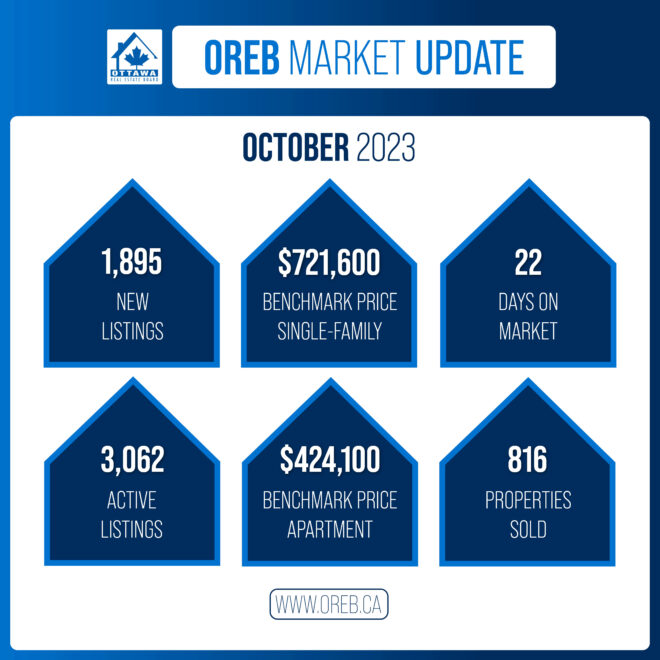
The number of homes sold through the MLS® System of the Ottawa Real Estate Board totaled 816 units in October 2023. This was a small reduction of 2.7% from October 2022.

Home sales were 36.4% below the five-year average and 30.8% below the 10-year average for the month of October.

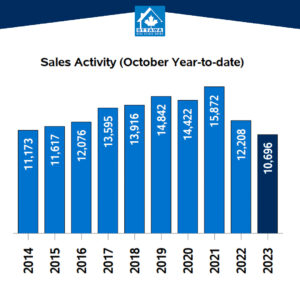
On a year-to-date basis, home sales totaled 10,700 units over the first 10 months of the year. This was a substantial decline of 12.3% from the same period in 2022.

Life is expensive these days, which likely has both buyers and sellers staying put. We’re seeing a slow decline in sales activity but it’s minimal and not unexpected for this time of year. Prices are adjusting and coming down, which is also indicative of the types of homes that are selling — apartments seeing the largest increase in sales activity over last October. While Ottawa’s inventory is slowly building, chronic supply issues mean there’s always an undercurrent of demand. Don’t let the lull fool you: now is a prime time for buyers to be looking for opportunities before the current carries us from a balanced market into seller’s territory.

BY THE NUMBERS: PRICES

The MLS® Home Price Index (HPI) tracks price trends far more accurately than is possible using average or median price measures.

  • The overall MLS® HPI composite benchmark price was $638,600 in October 2023, nearly unchanged, up only 1.8% from October 2022.
    • The benchmark price for single-family homes was $721,600, up 2.2% on a year-over-year basis in September.
    • By comparison, the benchmark price for a townhouse was $501,100, nearly unchanged, up 1% compared to a year earlier.
    • o The benchmark apartment price was $424,100, unchanged from year-ago levels.
  • The average price of homes sold in October 2023 was $660,836, increasing 2.9% from October 2022. The more comprehensive year-to-date average price was $671,983, a decline of 5.9% from the first ten months of 2022.
  • The dollar value of all home sales in October 2023 was $539.2 million, unchanged from the same month in 2022.

OREB cautions that the average sale price can be useful in establishing trends over time but should not be used as an indicator that specific properties have increased or decreased in value. The calculation of the average sale price is based on the total dollar volume of all properties sold. Price will vary from neighbourhood to neighbourhood.
 

BY THE NUMBERS — INVENTORY AND NEW LISTINGS

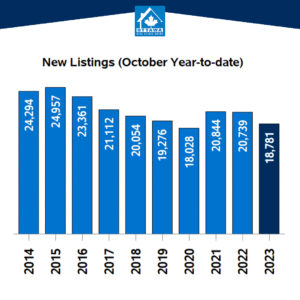
  • The number of new listings saw an increase of 6.6% from October 2022. There were 1,895 new residential listings in October 2023. New listings were 2% above the five-year average and 5.4% above the 10-year average for the month of October.
  • Active residential listings numbered 3,062 units on the market at the end of October, a sizable gain of 16.7% from the end of October 2022. Active listings haven’t been this high in the month of October in more than five years.
  • Active listings were 43.8% above the five-year average and 10.9% below the 10-year average for the month of October.
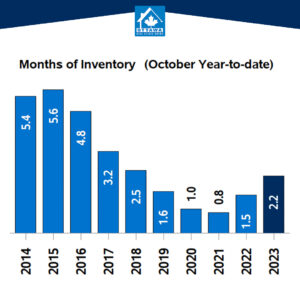
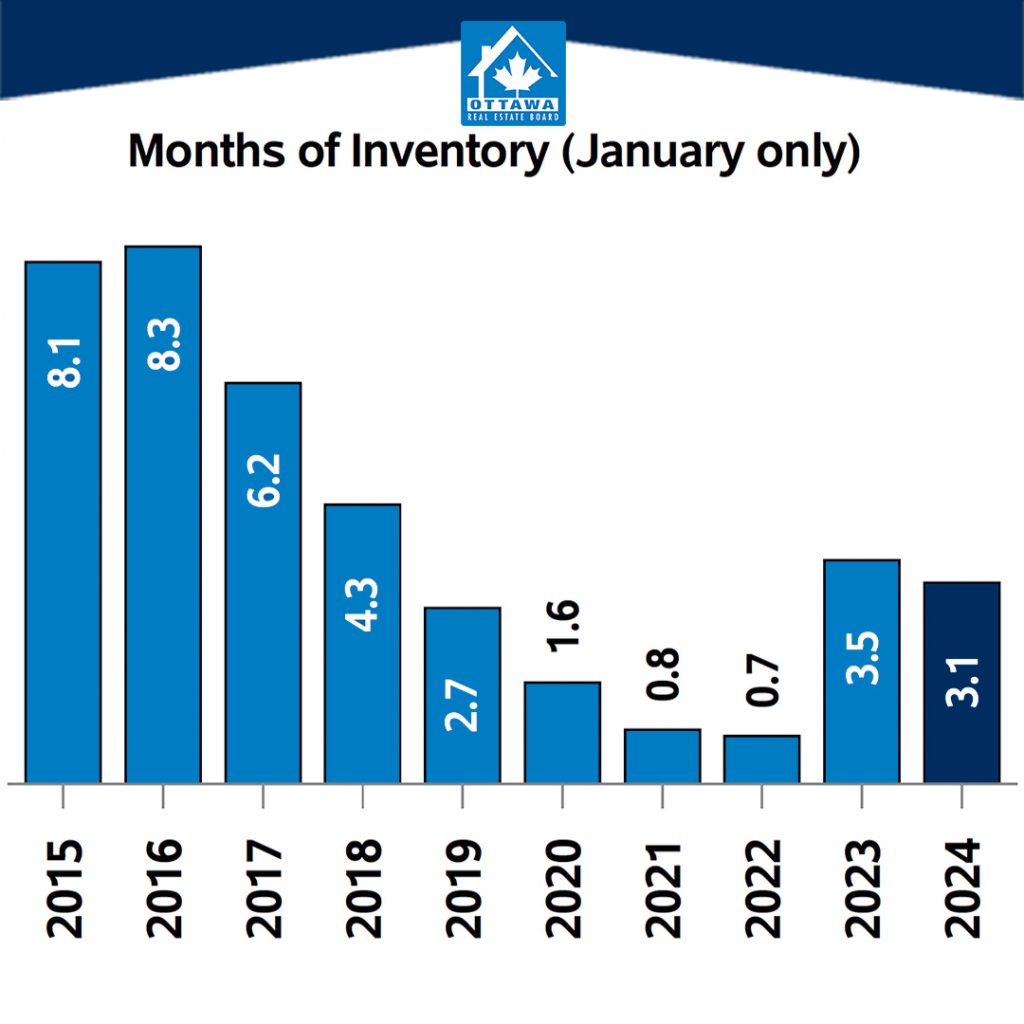
  • Months of inventory numbered 3.8 at the end of October 2023, just up from the 3.1 months recorded at the end of October 2022. The number of months of inventory is the number of months it would take to sell current inventories at the current rate of sales activity.
In conjunction with the Ottawa Real Estate Board (OREB), historical data may be subject to revision moving forward. This could temporarily impact per cent change comparisons to data from previous years.

Distinctive Real Estate Advisors Inc., Brokerage is pleased to present a recap of the latest market forecast release and October highlights from the Ottawa Real Estate Board (OREB).

We’d welcome an opportunity to discuss the Ottawa MLS® October Home Sales Show Typical Lull. If you have any questions about our services, please contact our team.
GTA REALTORS® Release October 2023 Stats

  • Lack of affordability and uncertainty remained issues for many would-be home buyers in the Greater Toronto Area (GTA) in October 2023. As a result, sales edged lower compared to last year.
  • Selling prices remained higher than last year’s levels. Record population growth and a relatively resilient GTA economy have kept the overall demand for housing strong.
  • More of that demand has been pointed at the rental market, as high borrowing costs and uncertainty on the direction of interest rates has seen many would-be home buyers remain on the sidelines in the short term. When mortgage rates start trending lower, home sales are predicted to pick up quickly.

RESIDENTIAL STATS

REALTORS® reported 4,646 GTA home sales through TRREB’s MLS® System in October 2023 – down 5.8 per cent compared to October 2022. On a month-over-month seasonally-adjusted basis, sales were also down in comparison to September.

New listings in October 2023 were up noticeably compared to the 12-year low reported in October 2022, but up more modestly compared to the 10-year average for October. New listings, on a seasonally adjusted basis, edged slightly lower month-over-month compared to September 2023.

The October 2023 MLS® Home Price Index Composite benchmark and the average selling price were both up on year-over-year basis, by 1.4 per cent and 3.5 per cent respectively. On a seasonally adjusted basis, the MLS® HPI Composite benchmark edged lower compared to September 2023 while the average selling price remained at a similar level. Both the MLS® HPI Composite benchmark and average price remained above the cyclical lows experienced at the beginning of 2023.


Competition between buyers remained strong enough to keep the average selling price above last year’s level in October and above the cyclical lows experienced in the first quarter of this year. The Bank of Canada also noted this resilience in its October statement. However, home prices remain well-below their record peak reached at the beginning of 2022, so lower home prices have mitigated the impact of higher borrowing costs to a certain degree.

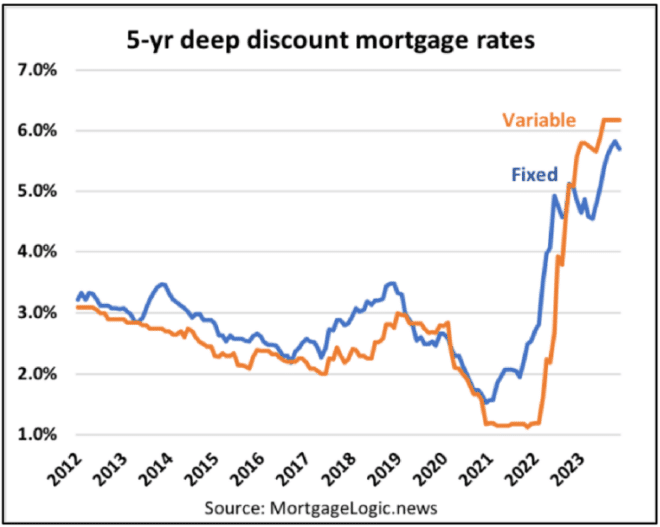
In the current environment of extremely high borrowing costs, it is disappointing to see that there has been no relief for uninsured mortgage holders reaching the end of their current term. If these borrowers want to shop around for a more competitive rate, they are still forced to unrealistically qualify at rates approaching eight per cent. Following their most recent round of consultations, the Office of the Superintendent of Financial Institutions should have eliminated this qualification rule for those renewing their mortgages with a different institution.

CONDO SALE STATS

CONDO RENTAL STATS

COMMERCIAL STATS

The “All Leasing Activity (Sq. Ft.)” chart summarizes total industrial, commercial/retail and office square feet leased through Toronto MLS® regardless of pricing terms.
The “All Sales Activity” chart summarizes total industrial and commercial/retail and office sales through Toronto MLS® regardless of pricing terms.

In conjunction with the Toronto Regional Real Estate Board (TRREB) redistricting project, historical data may be subject to revision moving forward. This could temporarily impact per cent change comparisons to data from previous years.

Distinctive Real Estate Advisors Inc., Brokerage is pleased to present a recap of the latest market forecast release and October highlights from the Toronto Regional Real Estate Board (TRREB).

We’d welcome an opportunity to discuss the GTA Realtors Release October 2023 Stats. If you have any questions about our services, please contact our team.
Ottawa MLS® Home Sales Hold Steady in Lackluster September

The number of homes sold through the MLS® System of the Ottawa Real Estate Board (OREB) totaled 946 units in September 2023. This was unchanged from September 2022.

Home sales were 29.6% below the five-year average and 23.6% below the 10-year average for the month of September. On a year-to-date basis, home sales totaled 9,889 units over the first nine months of the year. This was a large decline of 13% from the same period in 2022.

Sales activity came in right on par with where it stood at the same time last year but was still running well below typical levels for a September. New listings have surged in the past several months, which has caused overall inventories to begin gradually rising again. However, available supply is still low by historical standards, and we have ample room to absorb more listings coming on the market. Our market is also right in the middle of balanced territory, and while MLS® Benchmark prices are down from last year they are still trending at about the same levels from 2021.

BY THE NUMBERS — PRICES

The MLS® Home Price Index (HPI) tracks price trends far more accurately than is possible using average or median price measures.

  • The overall MLS® HPI composite benchmark price was $643,600 in September 2023, nearly unchanged, up only 0.5% compared to September 2022.
    • The benchmark price for single-family homes was $727,500, essentially unchanged, up just 0.6% on a year-over-year basis in September.
    • By comparison, the benchmark price for townhouse/row units was $510,900, a small gain of 2.5% compared to a year earlier, while the benchmark apartment price was $422,300, falling by 1.1% from year-ago levels.
  • The average price of homes sold in September 2023 was $675,412, increasing by 2.7% from September 2022. The more comprehensive year-to-date average price was $672,837, a decline of 6.5% from the first nine months of 2022.
  • The dollar value of all home sales in September 2023 was $638.9 million, up modestly by 2.7% from the same month in 2022.

OREB cautions that the average sale price can be useful in establishing trends over time but should not be used as an indicator that specific properties have increased or decreased in value. The calculation of the average sale price is based on the total dollar volume of all properties sold. Price will vary from neighbourhood to neighbourhood.

BY THE NUMBERS — INVENTORY & NEW LISTINGS

  • The number of new listings saw an increase of 9.8% from September 2022. There were 2,259 new residential listings in September 2023. New listings were 4.8% above the five-year average and 7% above the 10-year average for the month of September.
  • Active residential listings numbered 2,997 units on the market at the end of September, a sizable gain of 14% from the end of September 2022. Active listings haven’t been this high in the month of September in five years.
  • Active listings were 33.9% above the five-year average and 18.5% below the 10-year average for the month of September.
  • Months of inventory numbered 3.2 at the end of September 2023, up from the 2.8 months recorded at the end of September 2022 and below the long-run average of 3.3 months for this time of year. The number of months of inventory is the number of months it would take to sell current inventories at the current rate of sales activity.

In conjunction with the Ottawa Real Estate Board (OREB), historical data may be subject to revision moving forward. This could temporarily impact per cent change comparisons to data from previous years.

Distinctive Real Estate Advisors Inc., Brokerage is pleased to present a recap of the latest market forecast release and September highlights from the Ottawa Real Estate Board (OREB).

We’d welcome an opportunity to discuss the Ottawa MLS® Home Sales Hold Steady in Lackluster September. If you have any questions about our services, please contact our team.
« Older Entries

Newer Entries »